![GOSAT PROJECT [ THE GREENHOUSE GASES OBSERVING SATELLITE: GOSAT 'IBUKI' ]](../../img/img_top.jpg)
2014
May, 2014
May 8, 2014
NIES GOSAT Project Office
TANSO-CAI loaded on the Greenhouse gases Observing SATellite (GOSAT) "IBUKI" captures the smoke of wildfire in North Korea.
The Greenhouse gases Observing SATellite (GOSAT) "IBUKI" observes the greenhouse gases with TANSO-FTS and clouds and aerosols with TANSO-CAI globally for every 3 days. The smoke of wildfire was captured by TANSO-CAI observed on April 25, 2014.
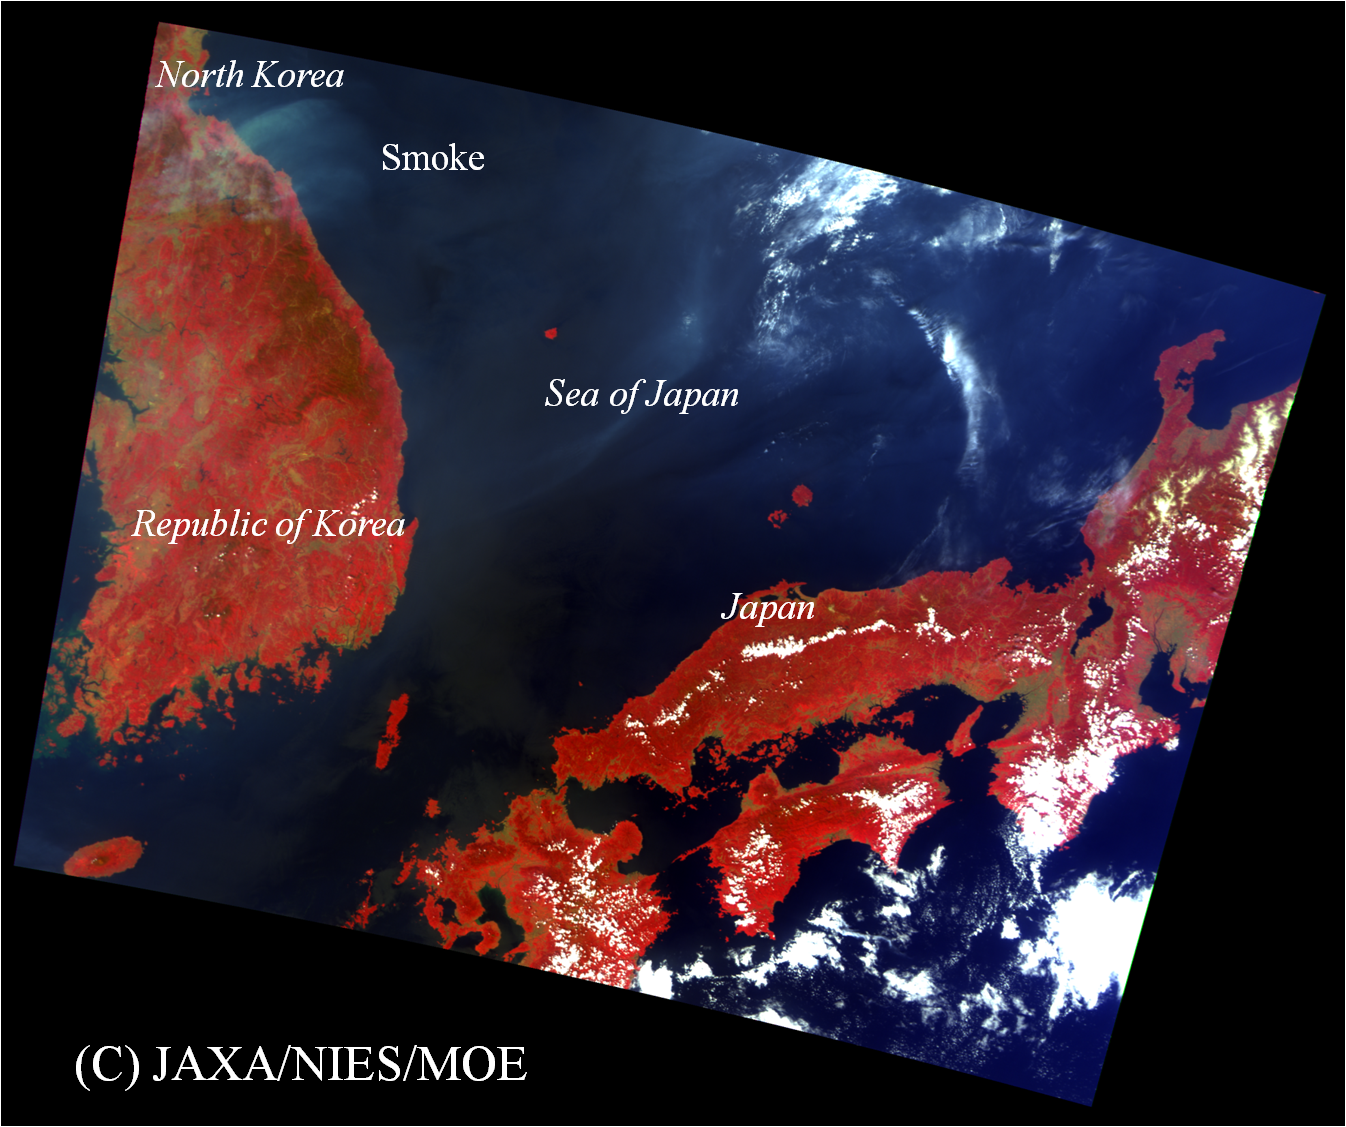
Figure 1. The smoke of wildfire in North Korea (Top left corner)
(Acquired at 4:26 UT on Apr. 25, 2014) (Click to enlarge)
TANSO-CAI is an imager to observe clouds and aerosols with 4 bands, whose central wave length are 1600 nm, 870 nm, 674 nm and 380 nm respectively. The color composite images of this article are created with its 870 nm data for red channel, 674 nm for green and 380nm for blue. The smoke is shown in yellow, clouds in white and land vegetation in red on this image.
About the original data product for this image
Sensor name: TANSO-CAI
Products: CAI L1B+ data product (V01.00)
Acquired date:
Figure 1:
At 4:26 (UT) on 25 April, 2014 as Frame 25 on Path 6
Image resolution: 500m/pixel
May 8, 2014
NIES GOSAT Project Office
TANSO-CAI loaded on the Greenhouse gases Observing SATellite (GOSAT) "IBUKI" captures sandstorms in the Mediterranean coast (northeast Libya), northern China, and western China.
The Greenhouse gases Observing SATellite (GOSAT) "IBUKI" observes the greenhouse gases with TANSO-FTS and clouds and aerosols with TANSO-CAI globally for every 3 days. The sandstorms of the three areas were captured by TANSO-CAI observed on April 23, 2014.

Figure 1. The sandstorm spreading toward the Mediterranean from northeast Libya
(Acquired at 11:31 to 11:33 UT on Apr. 23, 2014) (Click to enlarge)
TANSO-CAI is an imager to observe clouds and aerosols with 4 bands, whose central wave length are 1600 nm, 870 nm, 674 nm and 380 nm respectively. The color composite images of this article are created with its 870 nm data for red channel, 674 nm for green and 380nm for blue. The sand is shown in yellow, clouds in white and land vegetation in red on this image.

Figure 2. The sandstorm in northern China (On the left side of the figure)
(Acquired at 6:35 UT on Apr. 23, 2014) (Click to enlarge)

Figure 3. The sandstorm in western China (On the right side of the figure)
(Acquired at 8:13 UT, on Apr. 23, 2014) (Click to enlarge)
About the original data product for this image
Sensor name: TANSO-CAI
Products: CAI L1B+ data product (V01.00)
Acquired date:
Figure 1:
At 11:31 (UT) on 23 April, 2014 as Frame 25 on Path 19
At 11:33 (UT) on 23 April, 2014 as Frame 26 on Path 19
Figure 2:
At 06:35 (UT) on 23 April, 2014 as Frame 24 on Path 10
Figure 3:
At 08:13 (UT) on 23 April, 2014 as Frame 24 on Path 13
Image resolution: 500m/pixel