![GOSAT PROJECT [ THE GREENHOUSE GASES OBSERVING SATELLITE: GOSAT 'IBUKI' ]](../../img/img_top.jpg)
2011
January, 2011
January 31, 2011
The Greenhouse Gases Observing Satellite (GOSAT, "IBUKI") captured drift ice in the Sea of Okhotsk.
Image 1 was acquired when "IBUKI" passed over the Sea of Okhotsk during 12:45PM to 12:50PM on January 28, 2011. In the image, you can see drift ice moving towards the Okhotsk Coast of Hokkaido, Japan. Drift ice has come southward along the Sakhalin Coast all the way up from the north of the Sea of Okhotsk. n this image, the ice looks purple and the snow looks white. This is because “IBUKI” measures invisible light, the near infrared rays (0.86μm). Ice and water absorb the near infrared rays, and look tinted in “IBUKI”’s images. However, snow and clouds are reflected as white since snowflakes and cloud particles are tiny and they have a tendency to scatter light than to absorb. This causes the fresh drift ice to look purple, and to turn white as it is covered in snow, then to come back to purple as it melts. The image shows that drift ice in northern part of the Sea of Okhotsk is not snow-covered because it looks purple, and drift ice that reached Hokkaido is snow-covered. Mamiya Strait is all white, entirely blocked by ice and covered in snow.
Image 2 consists of the images from January 16, 19, 22, and 25. The amount of sea ice in the Sea of Okhotsk can be seen gradually increasing, and the ice is drifting towards Hokkaido.
Image 3 shows that drift ice had not reached Hokkaido yet on January 30 of last year, meaning drift ice reached the coast earlier this year.
“IBUKI”’s images are false-color images produced by assigning band 2 (0.674μm) to red, band 3 (0.87μm) to green, and band 1 (0.38μm) to blue. This causes the images to have different color combination from that of what a person sees.

Drift ice of the Sea of Okhotsk on January 28, 2011, observed by “IBUKI”. (Click to enlarge.)
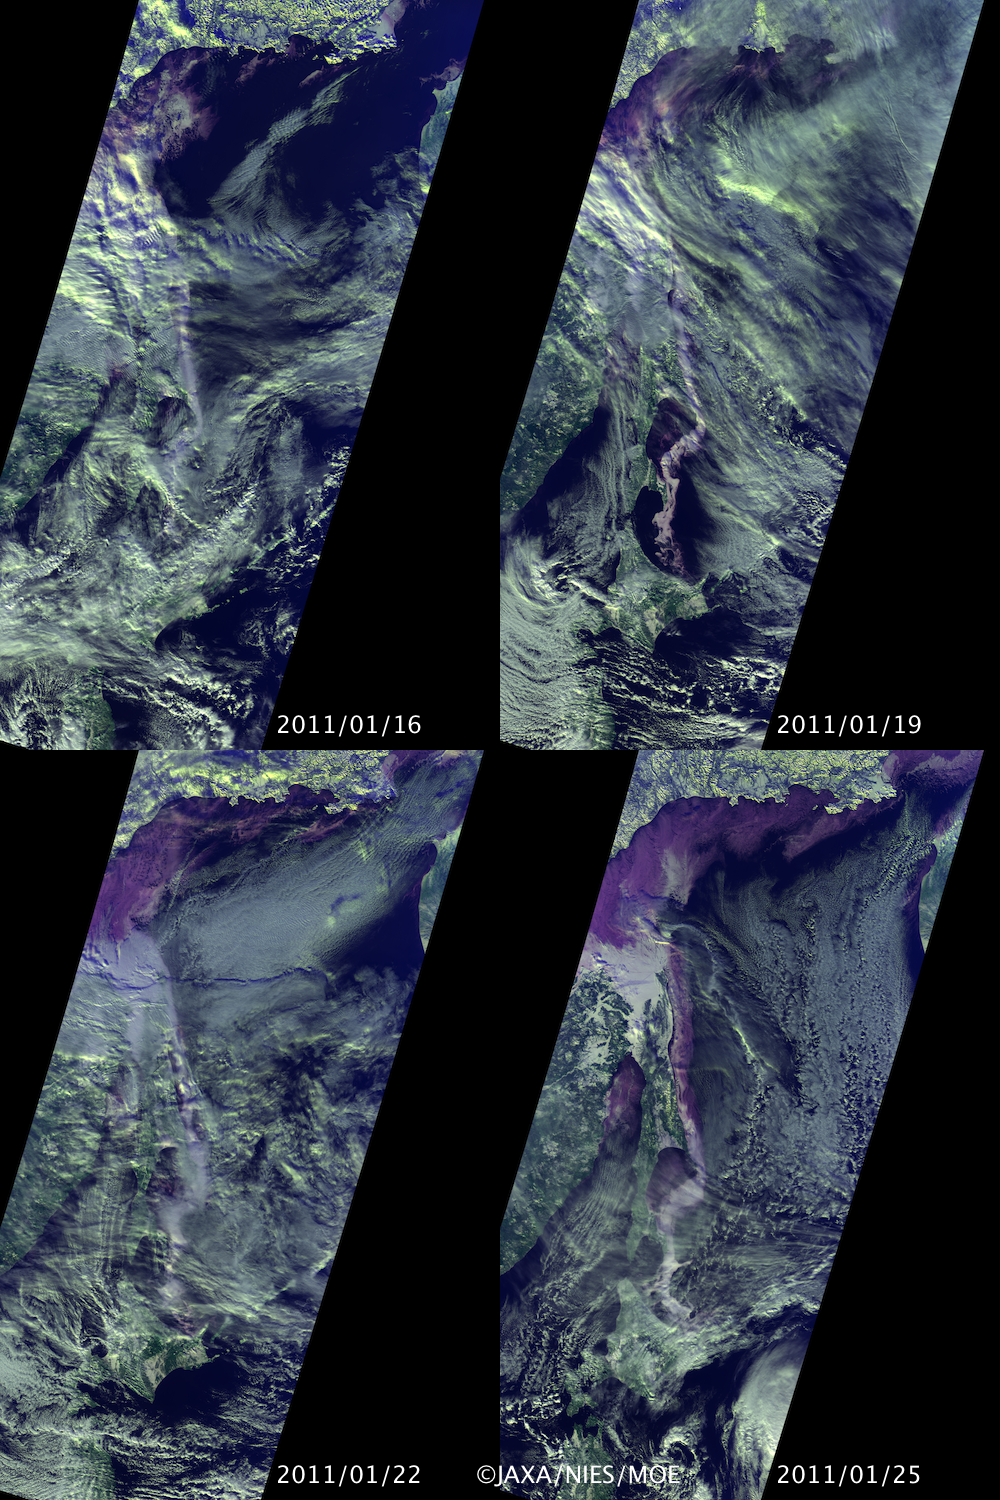
Image 2. Drift ice on January 16, 19, 22, and 25, observed by “IBUKI”. (Click to enlarge.)

Image 3. Drift ice of the Sea of Okhotsk on January 30, 2010, observed by “IBUKI”. (Click to enlarge.)
January 31, 2011
On January 29, 2011, the Greenhouse Gases Observing Satellite (GOSAT, "IBUKI") captured the eruption of Mt. Shinmoedake in the Kirishima mountain range in Kyushu, Japan. The activity of Mt. Shinmoedake has increased since January 26, 2011, and there were explosive eruptions on January 27 and 28. This image acquired by "IBUKI" on January 29 shows that the volcano continues erupting, and the volcanic plume spreading southeastward can be seen in between the cloud streaks produced by the seasonal wind accompanying winter pressure pattern. "IBUKI" passes and observes the same area on the globe every three days.
The volcanic plume of Mt. Shinmoedake in the Kirishima mountain range observed when “IBUKI” passed over the Kyushu District of Japan at 1:26PM on January 29, 2011 (JST). The red triangle indicates the location of the Kirishima mountain range.
(Click to enlarge.)
January 27, 2011
The Greenhouse Gases Observing Satellite (GOSAT, “IBUKI”) captured the volcanic plume of Mt. Shinmoedake in the Kirishima mountain range in Japan. The image was acquired when “IBUKI” passed over the Kyushu District at 1:26PM on January 26, 2011 (JST). The image shows that a volcanic plume is spreading southeastward, coming from the Kirishima mountain range (a red triangle in the image) located on the border of Miyazaki Prefecture and Kagoshima Prefecture. Miyakonojo City of Miyazaki Prefecture is right on the path of plume. According to the Japan Meteorological Agency, the volcanic activity of Mt. Shinmoedake has increased considerably after 3:00PM. What “IBUKI” captured is the volcano before the increase of activity. The image is a false color image produced from the data acquired by the Cloud and Aerosol Imager (CAI) installed on “IBUKI.” (Red = Band 2, Green = Band 3, Blue = Band 1.)
The volcanic plume of Mt. Shinmoedake in the Kirishima mountain range observed when “IBUKI” passed over the Kyushu District of Japan at 1:26PM on January 26, 2011 (JST). The red triangle indicates the location of the Kirishima mountain range.
(Click to enlarge.)
January 7, 2011
The record-breaking flood that has hit Queensland state of Australia was captured in the images acquired by the Greenhouse gases Observing SATellite (GOSAT) "IBUKI". The two images compare the now flood-damaged area captured on January 4th, 2011, and on January 27th last year. The latest image shows the rivers are flooding and spread wide while the rivers are almost invisible in the image from the same season last year.
Reference:Queensland Rainfall and River Conditions - Australian Government Bureau of Meteorology.

fig.1 Acquired on January 4, 2011 by GOSAT "IBUKI"'s Cloud and Aerosol Imager.
*The golden glare in the image is reflection of sunlight. Queensland state is crossed by the Tropic of Capricorn, and the Sun is located right above the area in this time of year. The overflowing water of rivers shines acting as a mirror.
(Click to enlarge.)

fig2. Acquired on January 27, 2010 by GOSAT "IBUKI"'s Cloud and Aerosol Imager. (Click to enlarge.)