![GOSAT PROJECT [ THE GREENHOUSE GASES OBSERVING SATELLITE: GOSAT 'IBUKI' ]](../img/img_top.jpg)
- Top
- > FTS_L2_SWIR_CO2_gallery
GOSAT Level 2 Products have been released to the Public
JAXA, NIES and MOE have been jointly conducting Greenhouse gases Observation SATellite (GOSAT, Ibuki) Project. After the successful launch of GOSAT on January 23, 2009, physical quantity calculated from data observed by the Satellite and the results of the analysis have been evaluated. At this moment, since validation results of L2 products are obtained, we would like to announce that GOSAT Level 2 Products are released to the Public on February 18, 2010.
Some parts of the released L2 Products were already studied by the researchers selected by the Research Announcement.
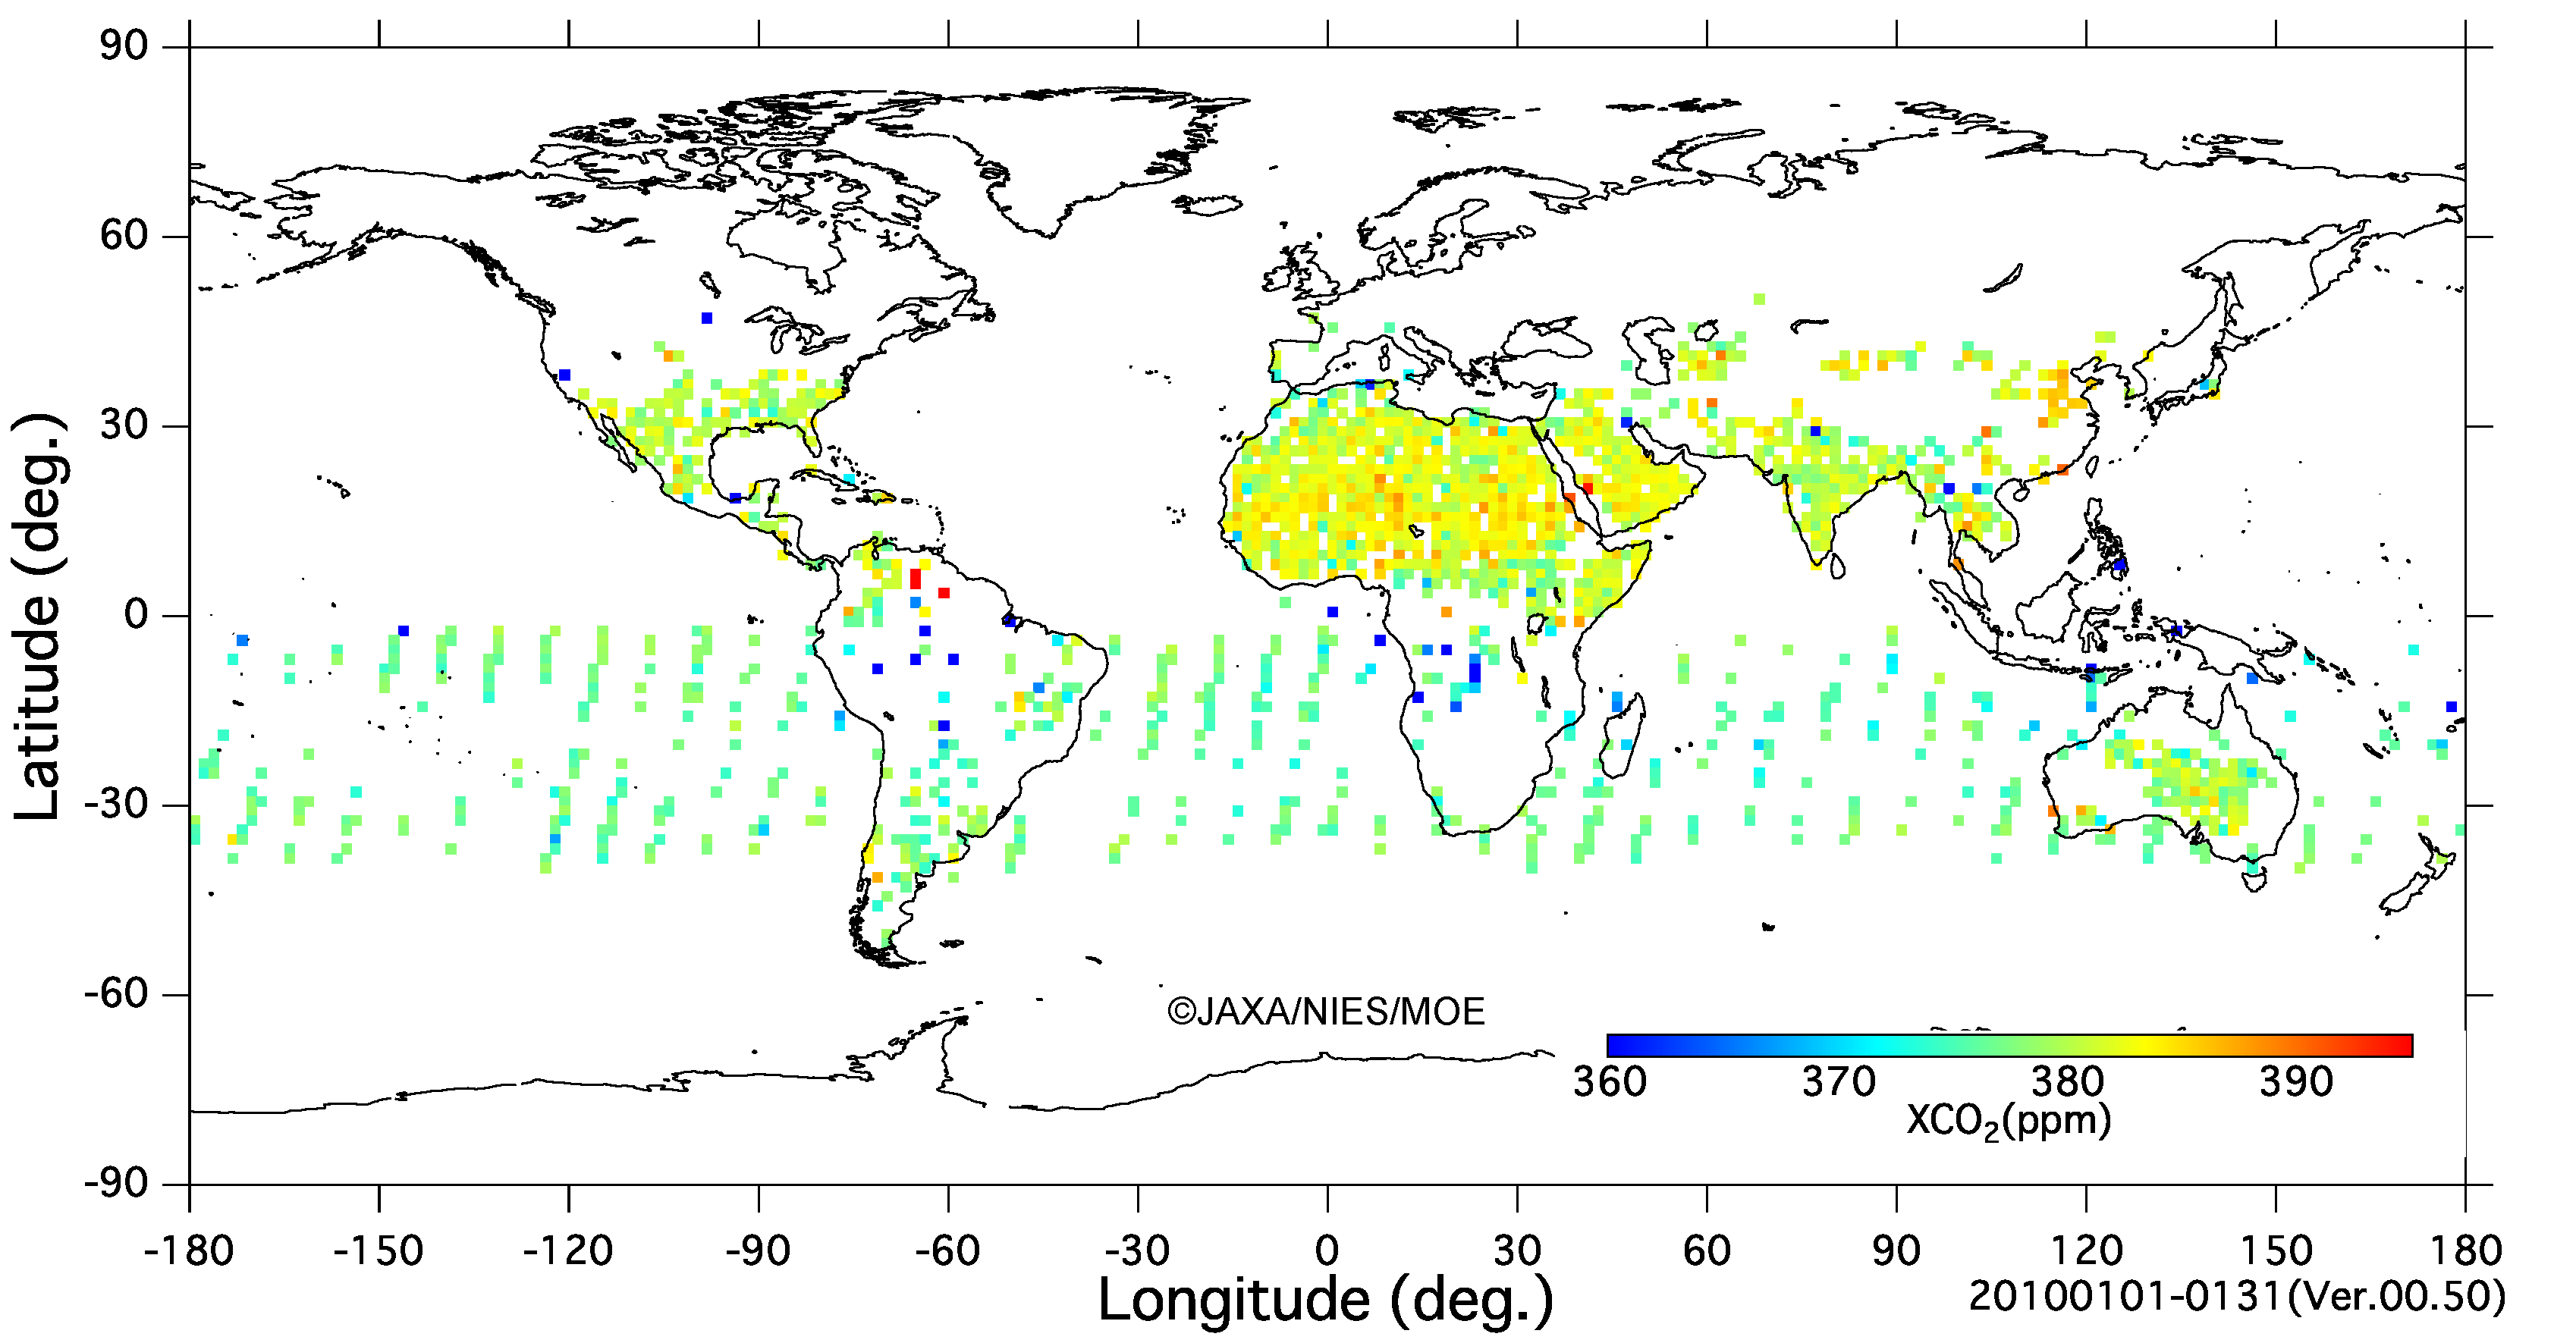
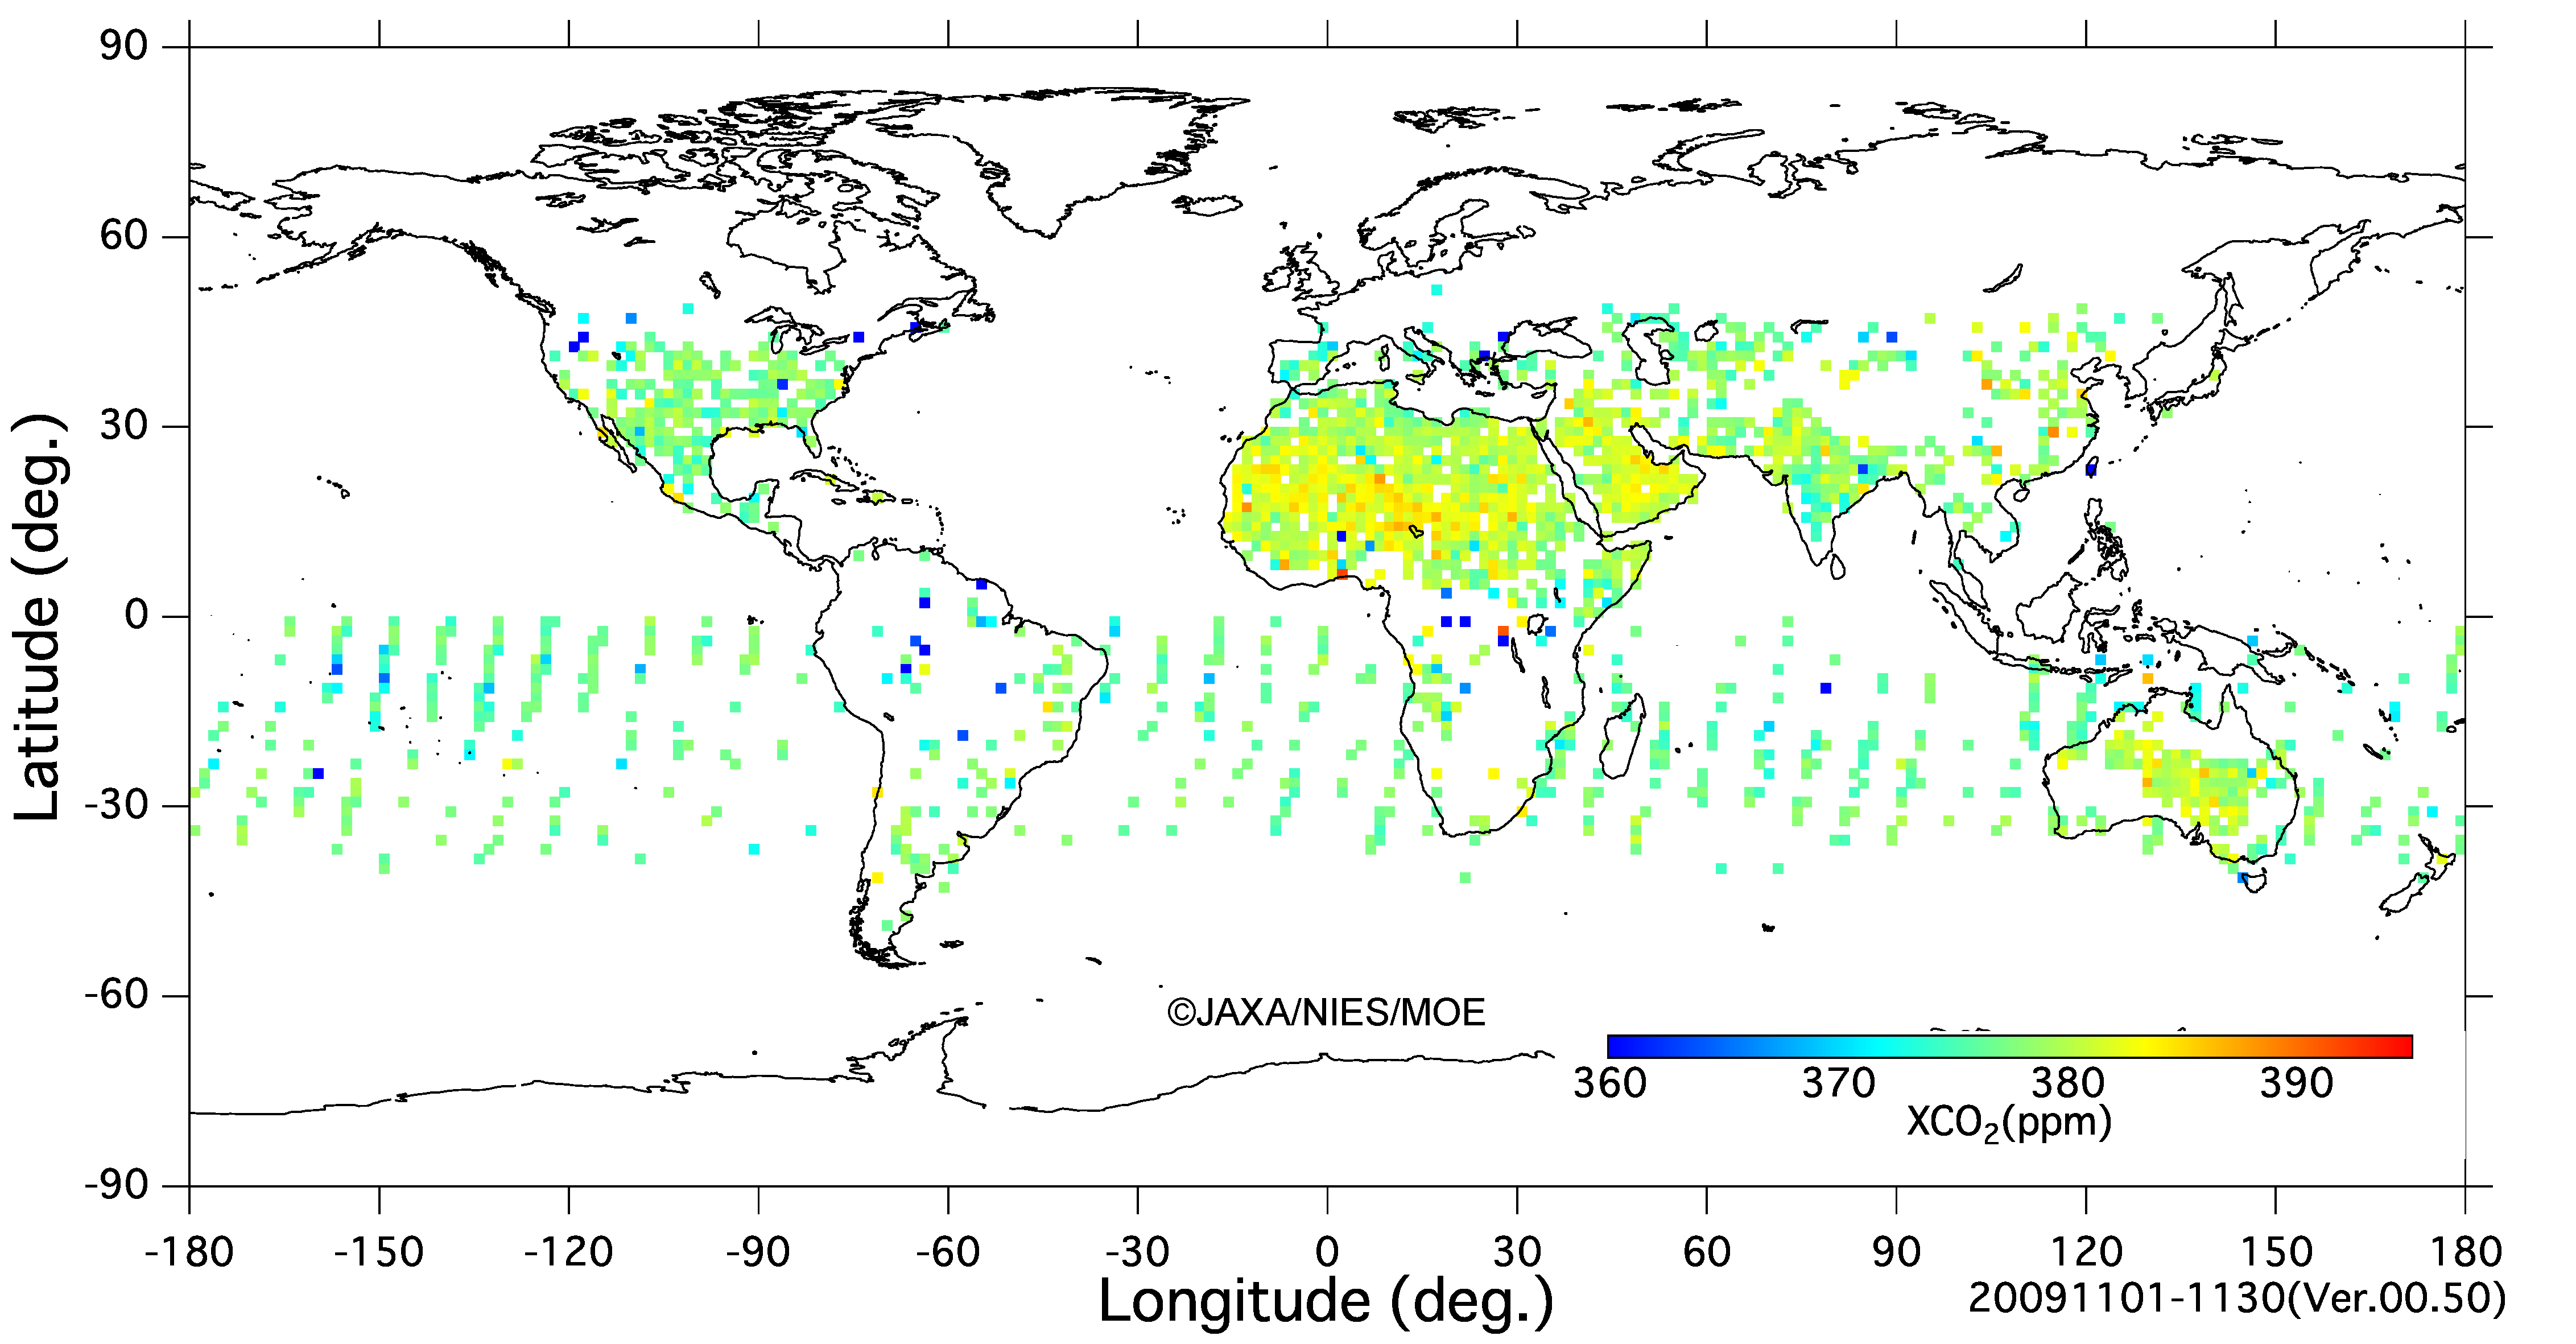
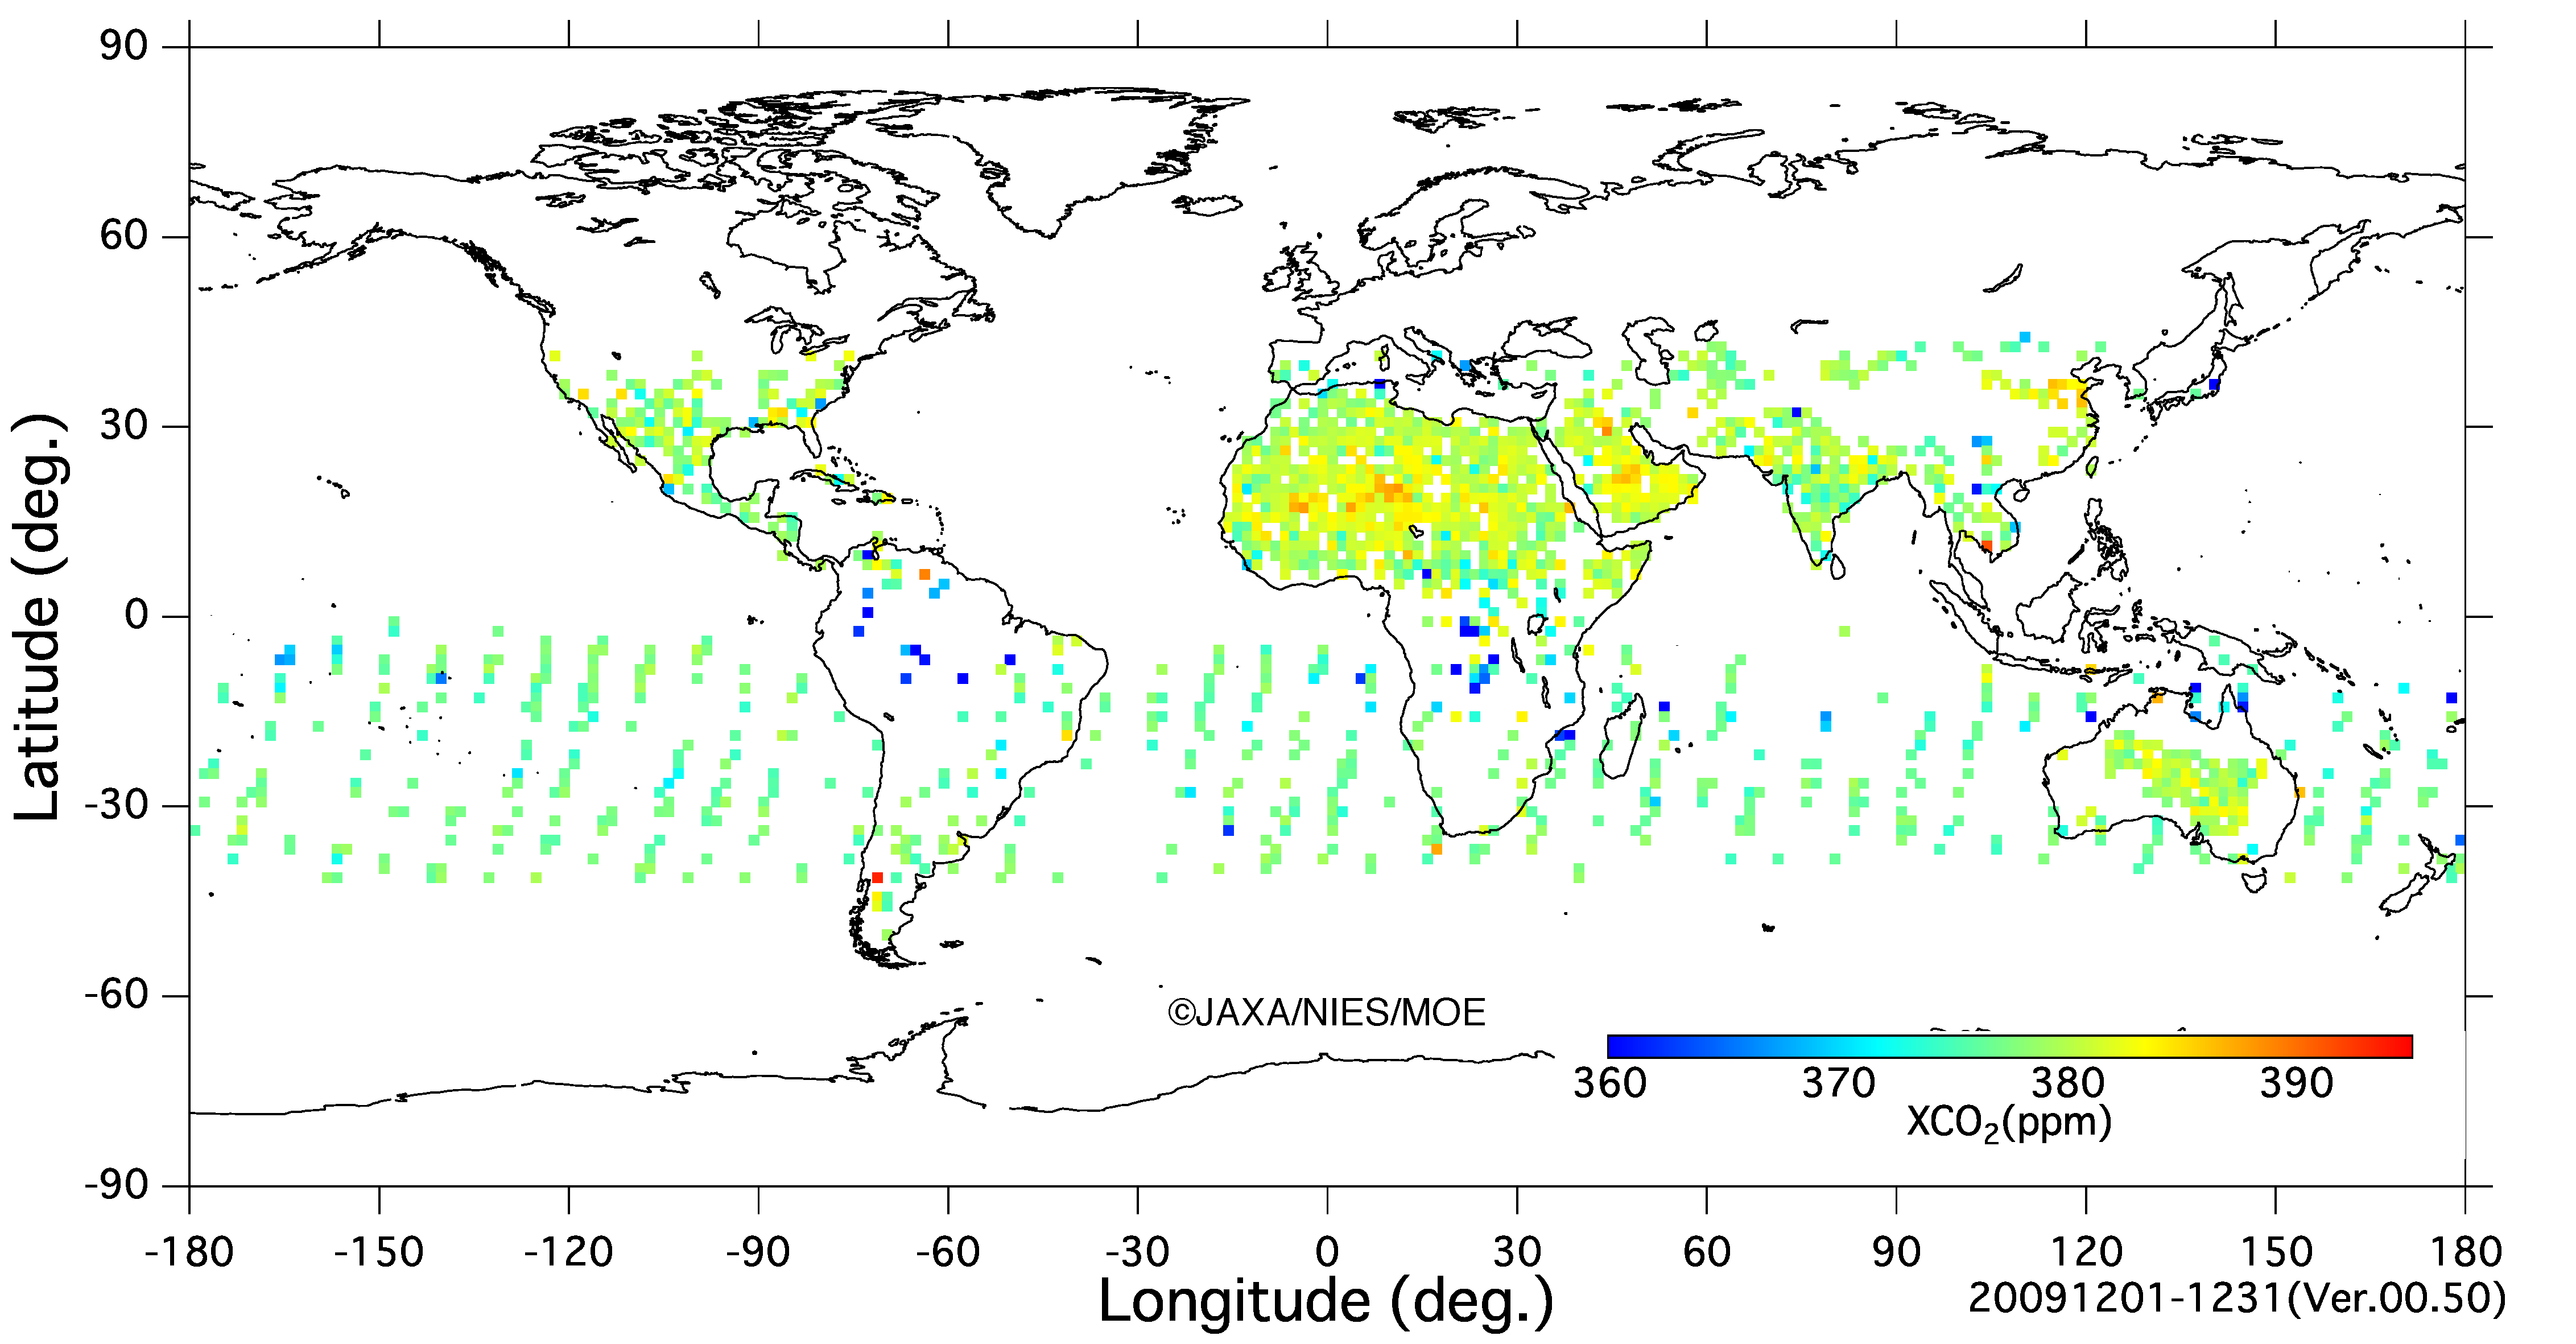
The L2 FTS Products ( column-averaged volume mixing ratios, xCO2, xCH4 ) show a result of zonal ( North-South )distribution almost consistent with existing results. However, it should be noticed that the current L2 results have 2 to 3 % lower concentration values than those observed by FTS at validation sites or other validation data. In addition, attention should be paid for the the aerosol in the atmosphere ( including dust ) which may cause errors to calculate xCO2 and xCH4. Please take into account these results when you use the FTS L2 data. We are planning the improvement of the algorithm to resolve various problems including the above mentioned issues. If a direction for the improvement is finalized, a new product will be defined with new version,and all the past data will be reprocessed by the new algorithm.
We are hoping that Ibuki ( GOSAT ) Products be used not only for the research of Global Warming, but also in various application fields.
[Summary of released data products and how to obtain them]
The GOSAT Level 2 Data Products (TANSO-FTS SWIR Level 2 and TANSO-CAI Level 2 Data Products) are now publicly available. These data are available for downloading at the GOSAT DATA Archive Service (GDAS). User registration is required. This can be done by accessing GDAS at http://data.gosat.nies.go.jp/.
Monthly Global Map of the CO2 column-averaged volume mixing ratios in 1.5 deg by 1.5 deg mesh
Maps cover April, June, July, Nov. Dec. of 2009, and Jan., 2010, where the ver.00.50 data are available
(Click the figure to zoom the image)
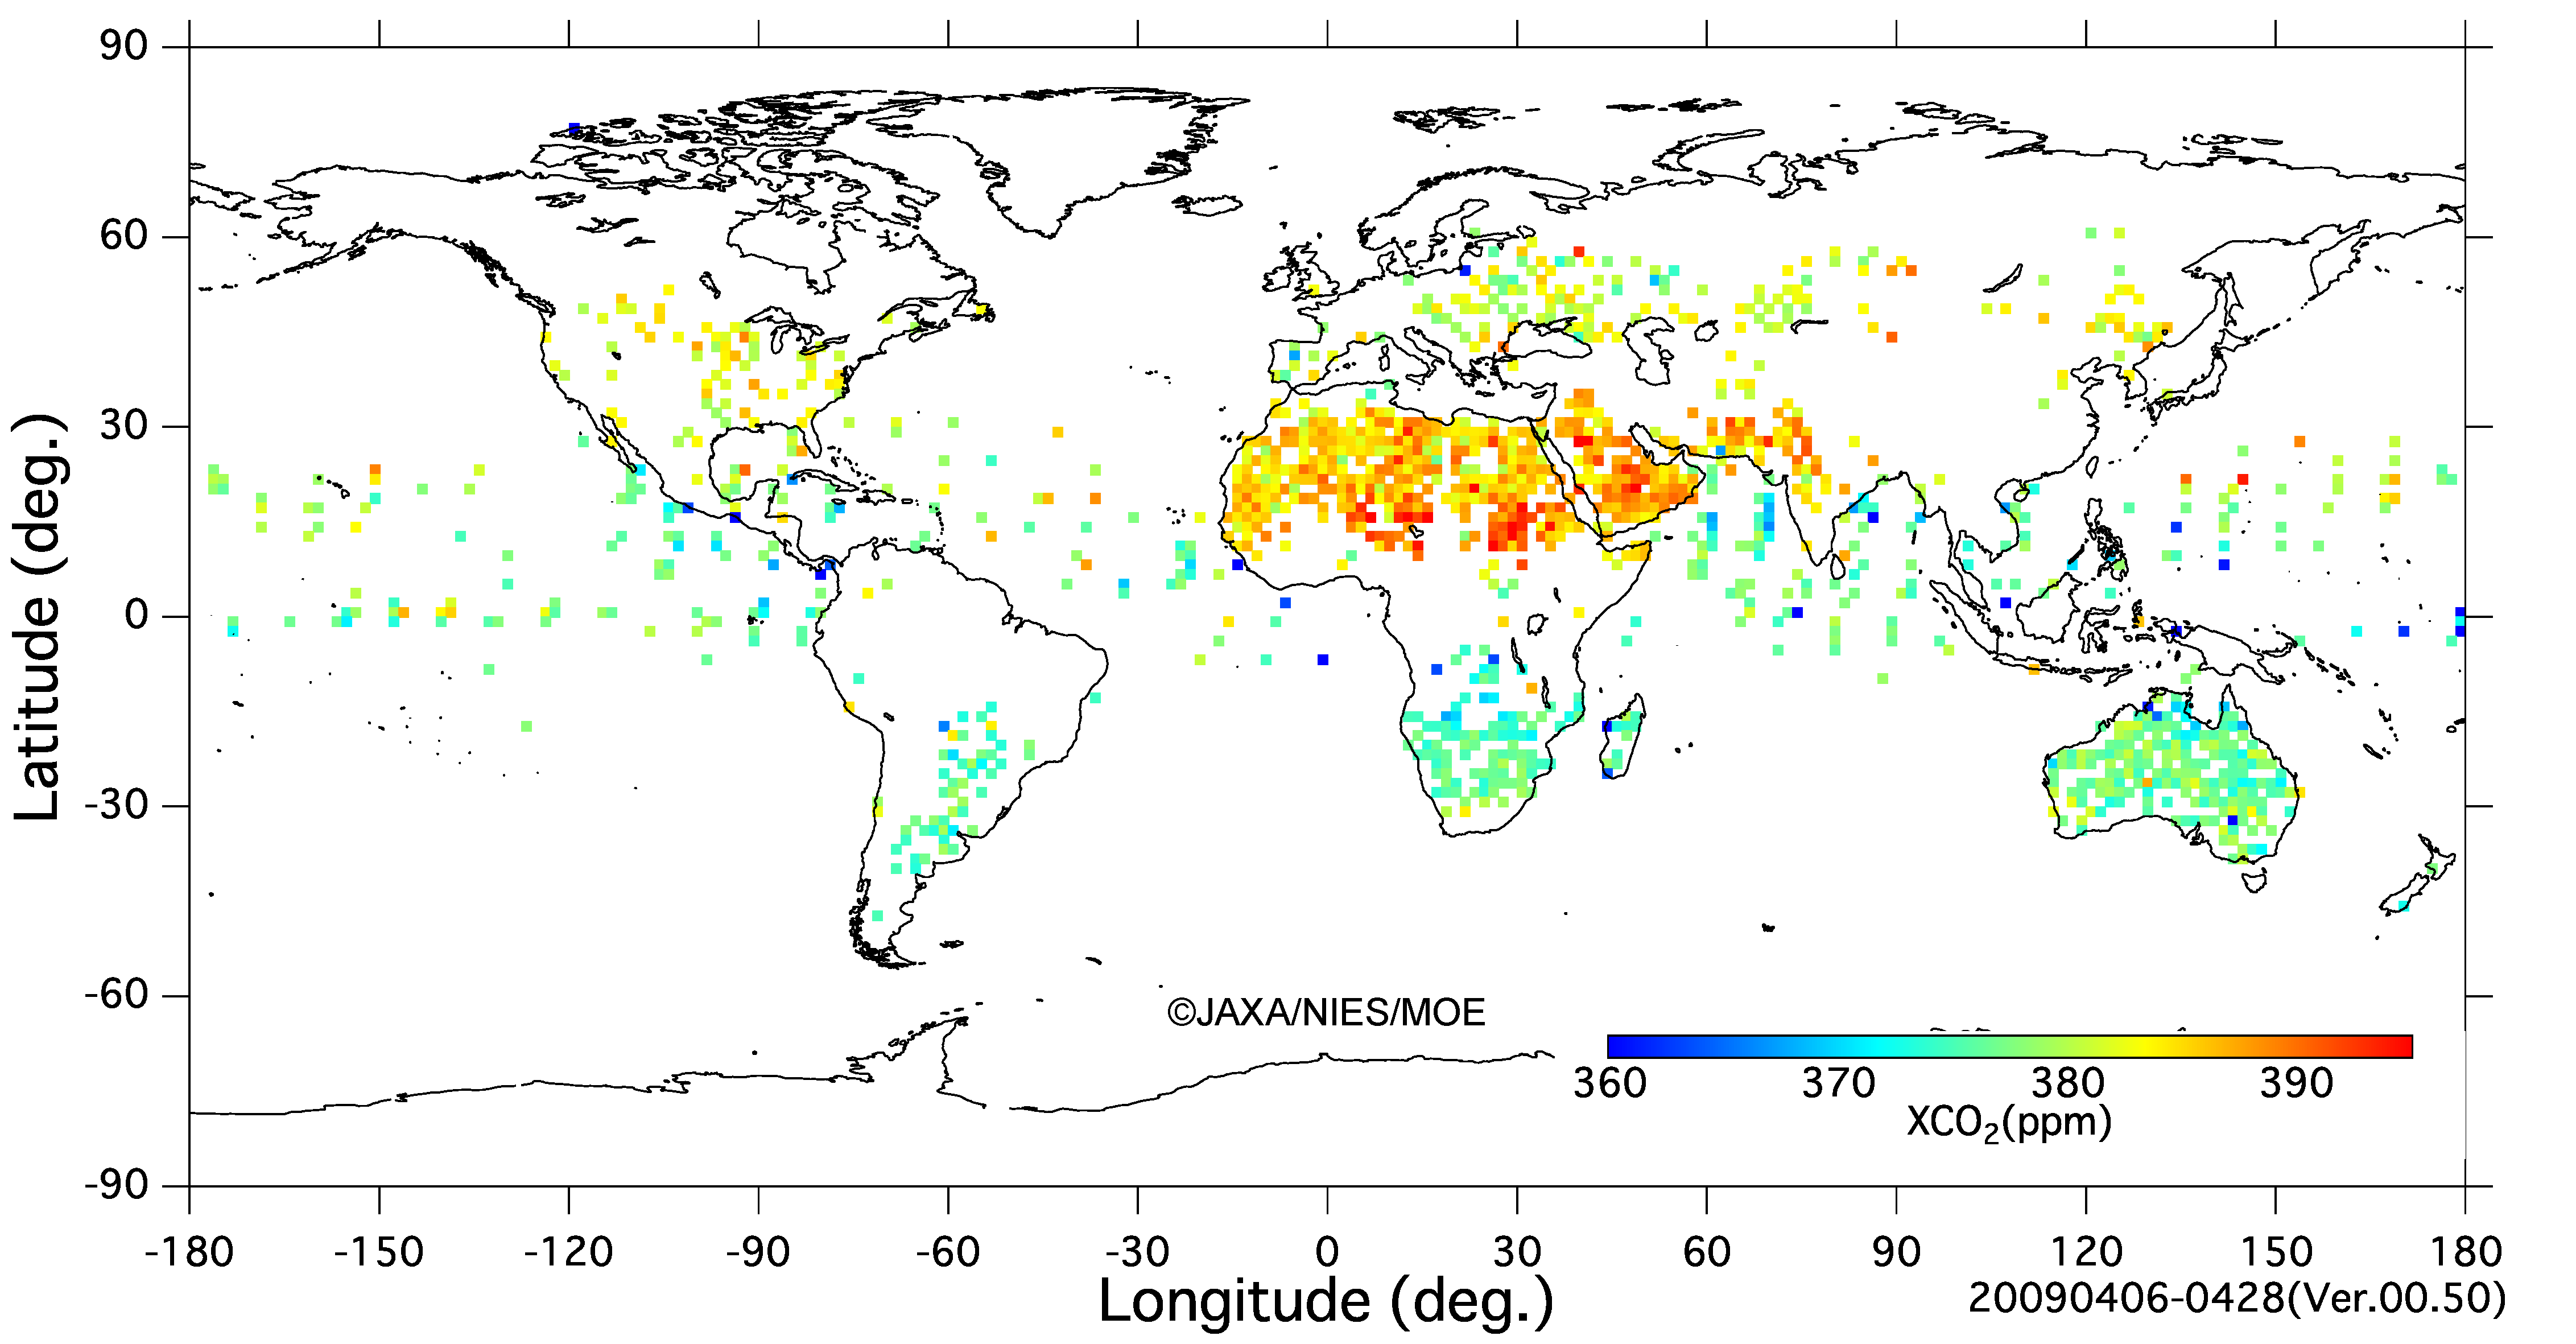
(Click the figure to zoom the image)
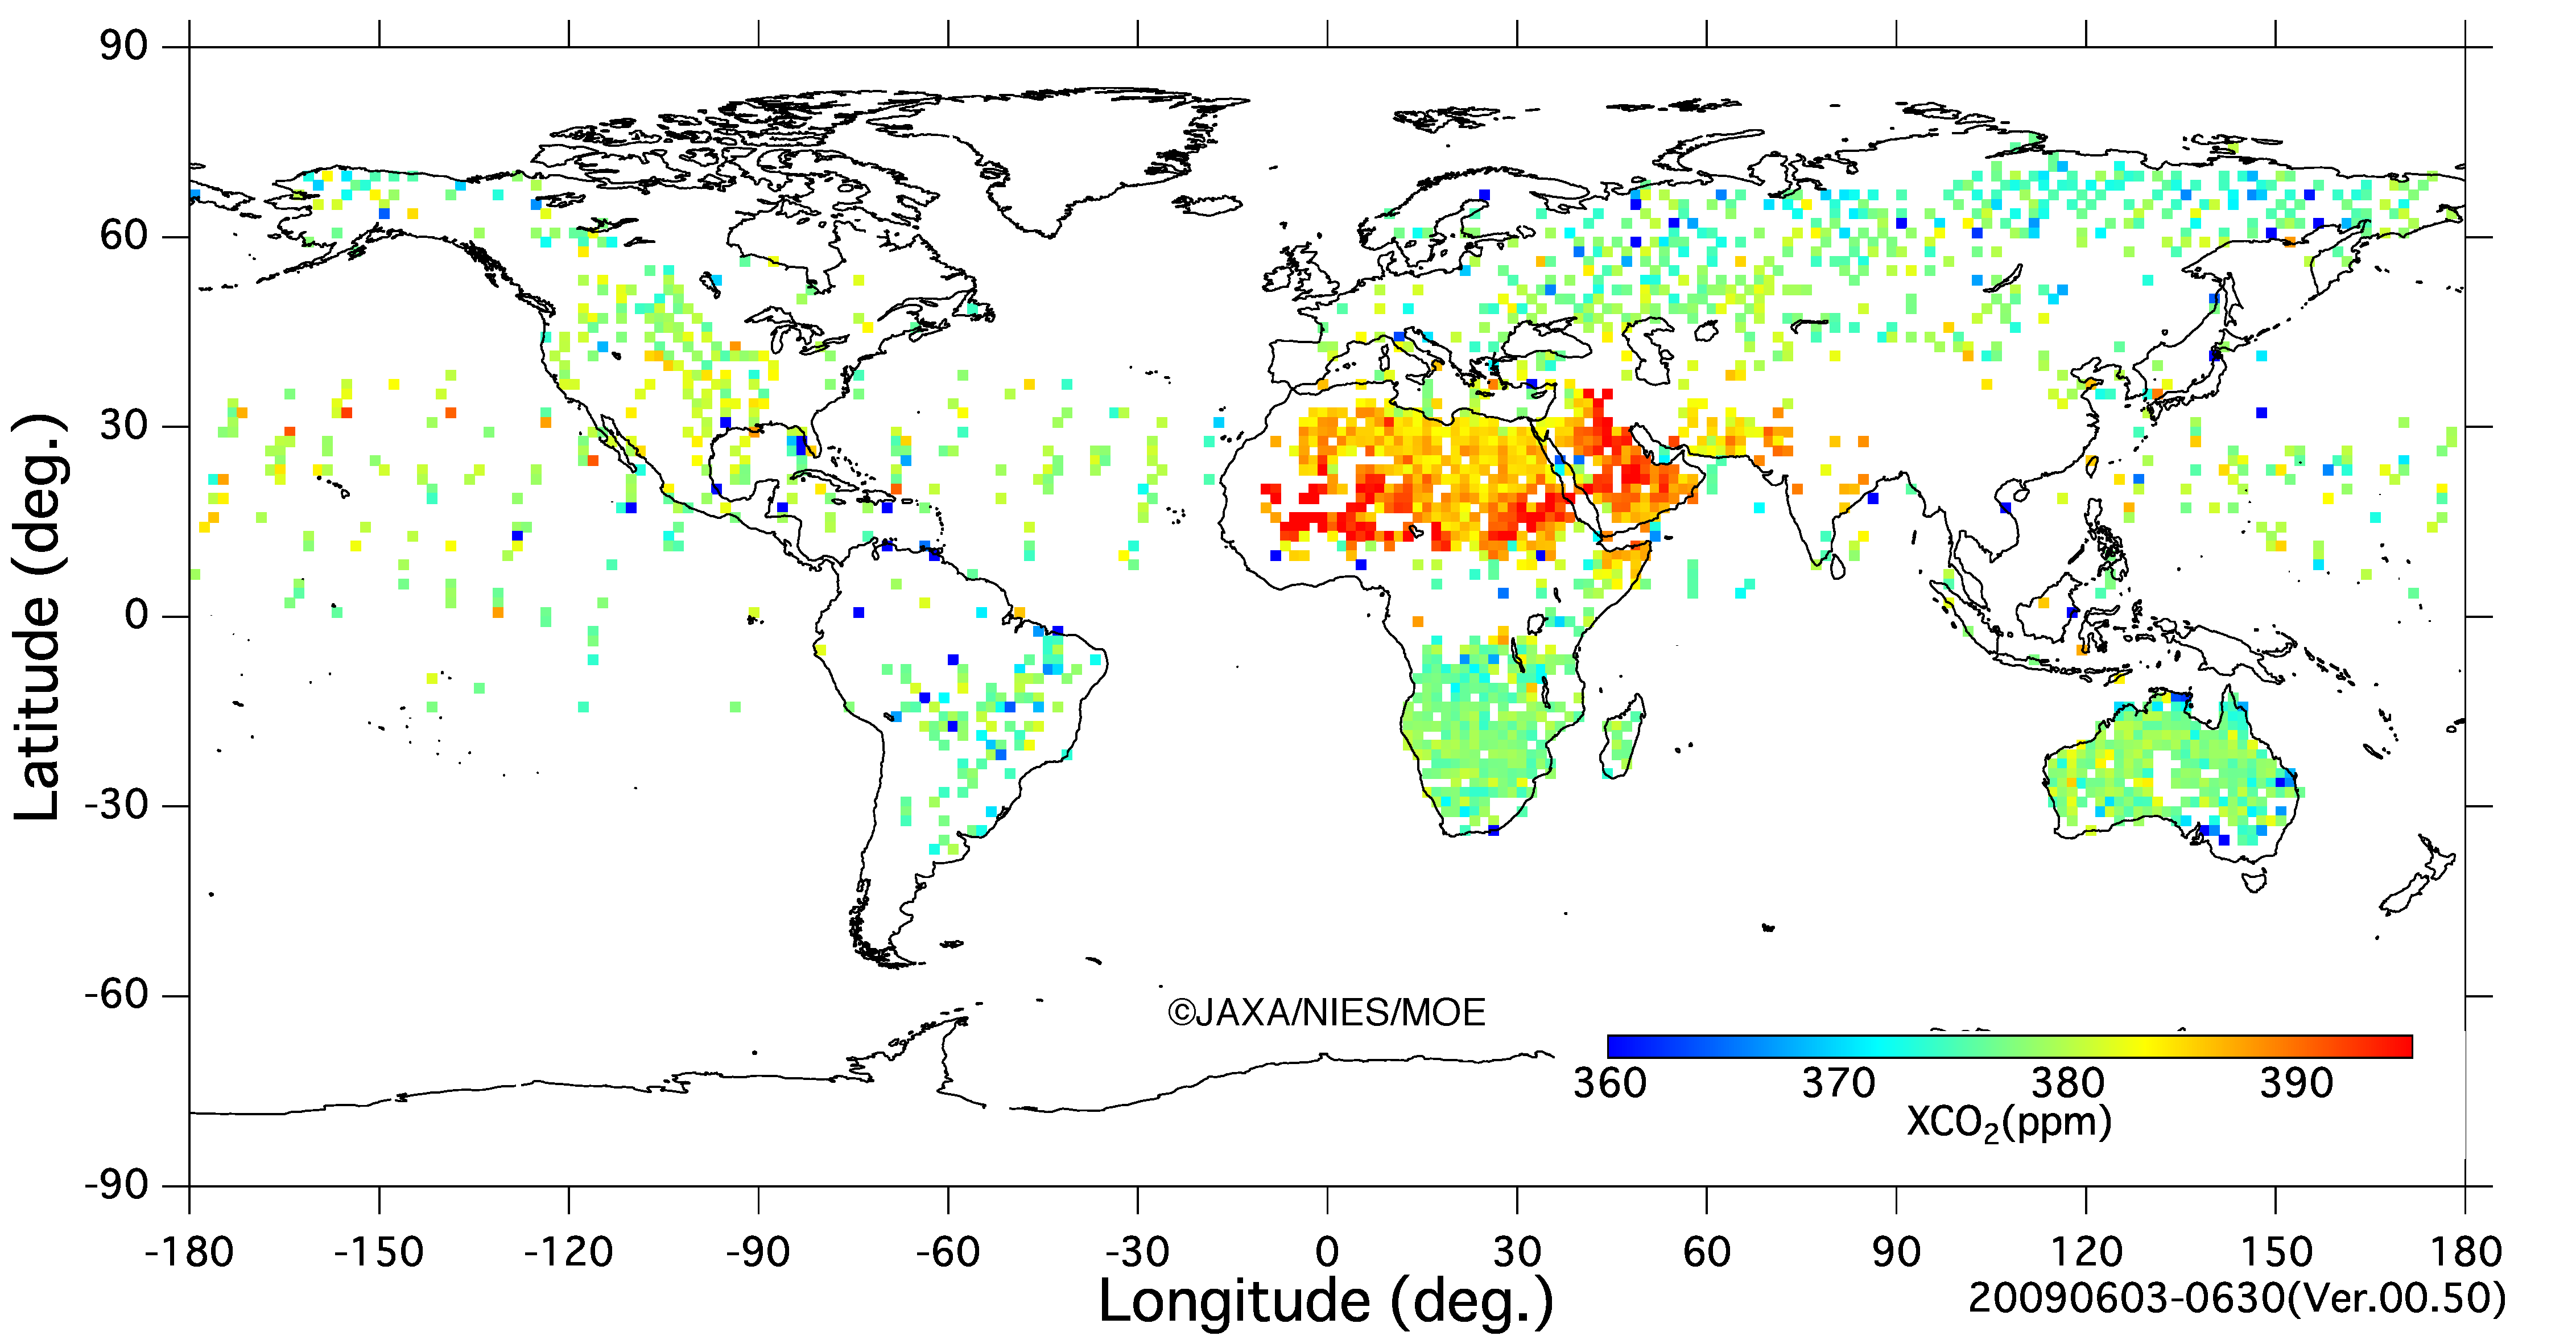
(Click the figure to zoom the image)
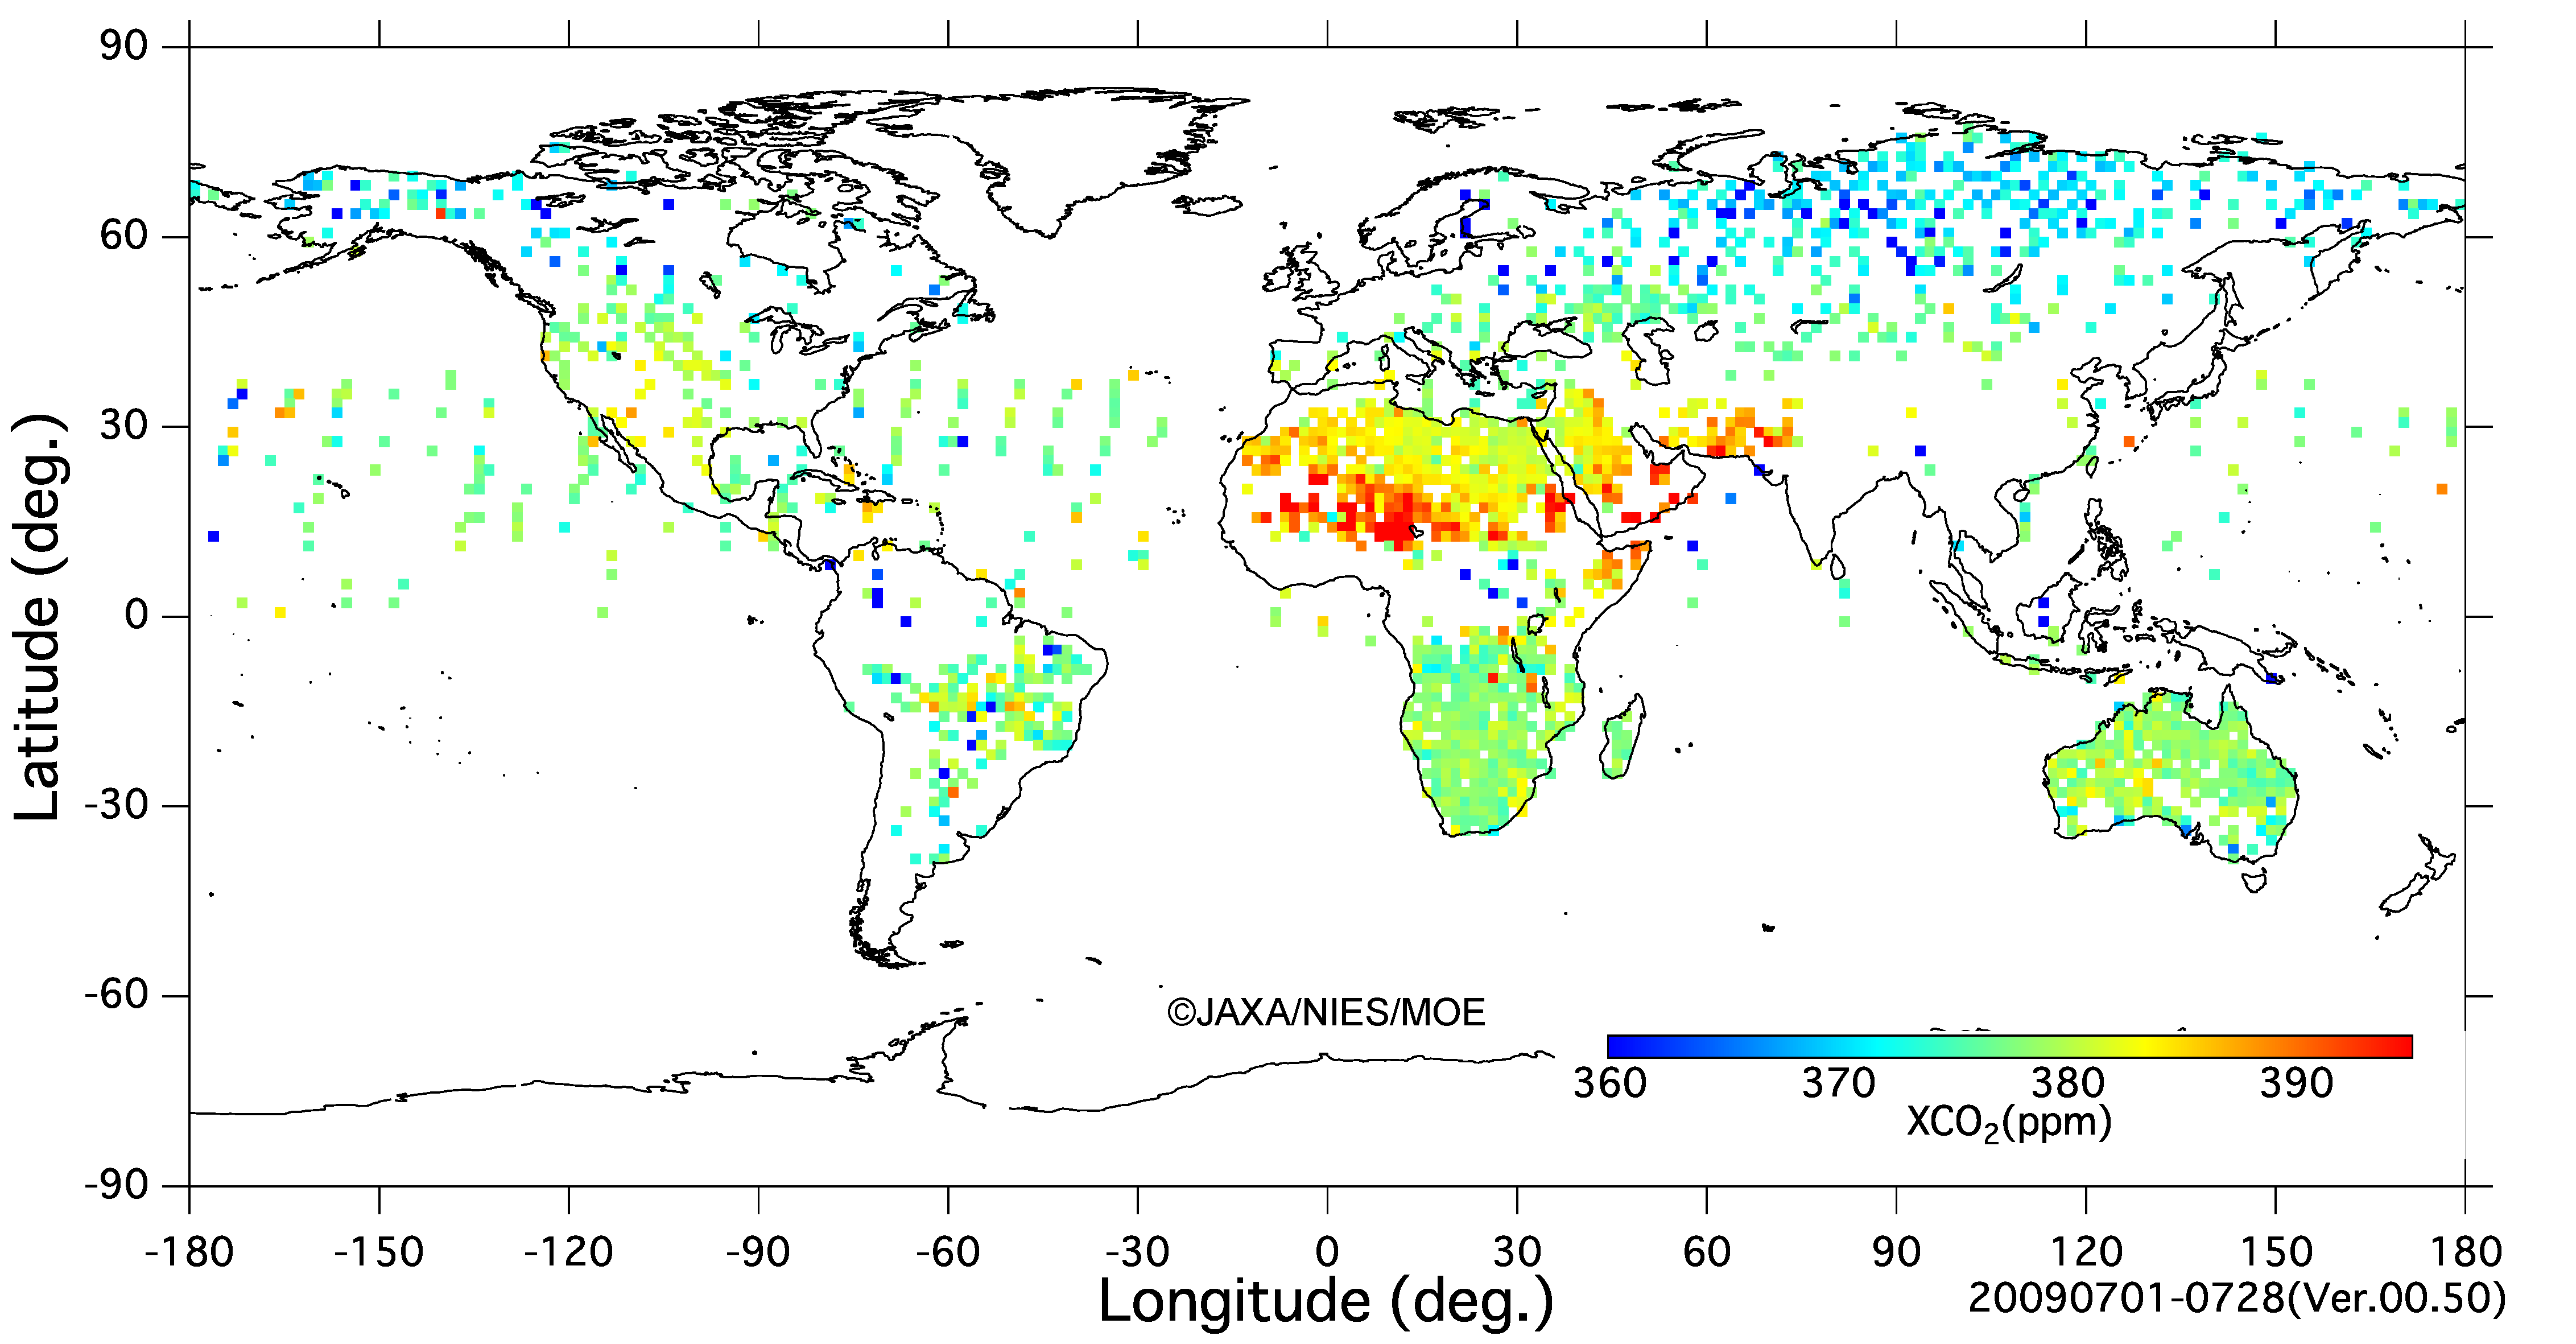
(Click the figure to zoom the image)
(Click the figure to zoom the image)
(Click the figure to zoom the image)