[3] Methods of Analyzing GOSAT Data
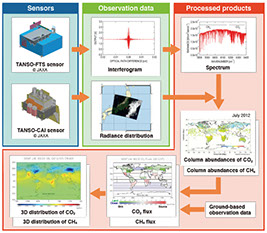
Data obtained with FTS and CAI are processed in the flow shown in Figure 7. Absorption spectra are obtained from the FTS observational data. The CAI data provide information on clouds and aerosols. These data are used together to calculate column abundances of CO2 and CH4 over observation points where interferences of clouds and aerosols are small. Sources and sinks as well as three-dimensional distributions of CO2 and CH4 are estimated using a global atmospheric transport model.
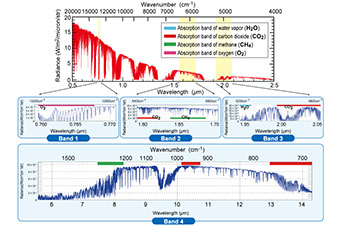
The molecules of CO2 and CH4 in the atmosphere absorb light of particular wavelengths. Hence, the amounts of CO2 and CH4 in an optical path can be calculated through measuring how much light is absorbed by these molecules. Figure 8 shows an example of absorption spectra that are obtained with FTS. The sawtoothed feature in the spectra indicates light absorption by gases such as CO2 and CH4, and the depression depth correlates with column abundances.
The spectral data are analyzed as follows. Among all spectra obtained with FTS, only those measured under no cloud interference within FOV are selected for further processing. This screening uses the images from CAI. Based on the absorption characteristics of the gases, the selected spectra are analyzed, using a numerical calculation scheme called the retrieval method, to calculate column abundances of CO2 and CH4. Changes in CO2 concentration are most obvious near the surface of the earth. The CO2 absorption bands near 1.6μm and 2.0μm are important since absorptions in these bands provide information on the near-surface concentrations. The absorption band around 14μm is used for obtaining information mainly at altitudes above 2 km.
The column abundances of CO2 and CH4 are then averaged on a weekly or monthly basis and processed into global distribution maps. The CO2 and CH4 global distribution data are used in the estimation of their sources and sinks on a subcontinental scale (Figure 5). The sources and sinks are calculated by performing inverse simulations using an atmospheric transport model.
In case of estimating sources and sinks of CO2 and CH4 by relying solely on ground-based observational data, estimation errors are particularly large in Siberia, Asia, Africa, and South America where ground monitoring stations are located sparsely. GOSAT is capable of collecting observational data consistently over the clear-sky regions of the globe and hence is expected to reduce errors in the estimates of their sources and sinks. Further, using these source and sink distribution data of CO2 and CH4, and the atmospheric transport model, the global distribution of CO2 and CH4 in three dimensions are simulated.