![GOSAT PROJECT [ THE GREENHOUSE GASES OBSERVING SATELLITE: GOSAT 'IBUKI' ]](../../img/img_top.jpg)
2009
October, 2009
October 30, 2009
from "IBUKI" Greenhouse gases Observing SATellite
(GOSAT)
The Ministry of the Environment (MOE), the National Institute for Environmental Studies (NIES), and the Japan Aerospace Exploration Agency (JAXA) are jointly promoting the Greenhouse gasses Observing SATellite "IBUKI" Project (GOSAT, launched on January 23, 2009). Recently, an initial calibration of Level 1 data products, radiance spectrum and images observed by IBUKI, has been completed and we will begin to release them to general users.
October 15, 2009
by the Greenhouse gases Observing SATellite "IBUKI" (GOSAT)
Recently, the Cloud Aerosol Imager (CAI) on board the "IBUKI" observed the severe dust storm over eastern Australia.
Several large-scale dust storms attacked the eastern Australia about a week since September 23, 2009. The dust storms were generated in the central Australia and blanketed the country with a record breaking amount of dust. In the big cities like Sydney, it was reported that a lot of people suffered from health problems induced by the dust and some of them were carried to a hospital. It also impacted traffics by causing the bad visibility, like the aircrafts having headed to Sydney needed to alternate their destination. CAI takes an image data of the entire globe over the three-day period by using a camera with a swath width of 1,000 km and a spatial resolution of 500 m at nadir direction (both are in Bands 1, 2, and 3.) CAI observes the entire globe periodically, and it observed the east coast of Australia 4 times during the period of the dust storms attack, which were the 20th of September (before they were generated,) the 23rd and 26th of September (in the middle of their attacks,) and 29th of September (after they disappeared out to the ocean.) Figure 2 are the data sets of CAI image data taken through the 4 observation periods. The dust storms (pictured in yellow,) spreading over from northwest to southeast, can be seen at the center of the data taken on September 23 and 26. Especially, the data of September 23 shows clearly that the dust storms reached Sydney and its surrounding areas. Seemingly, the storms disappeared out on September 29.
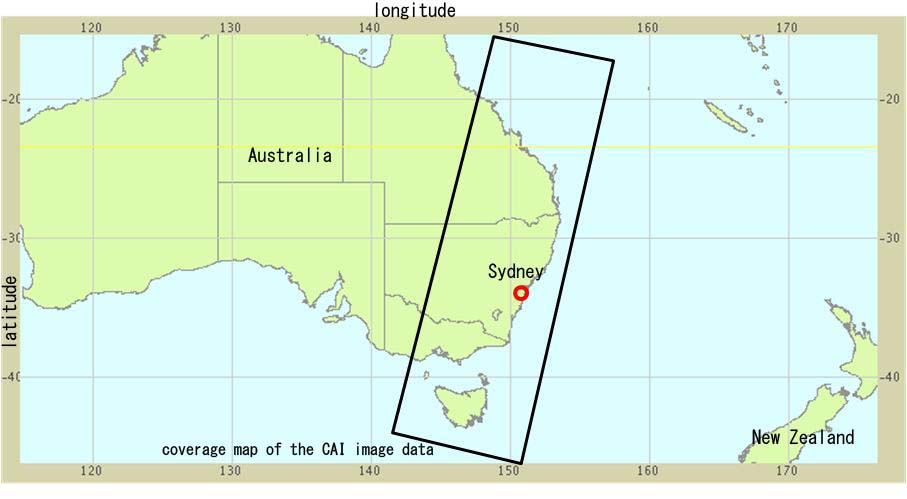
Figure 1: Coverage map of the CAI image data when the dust storms
over eastern Australia were observed.
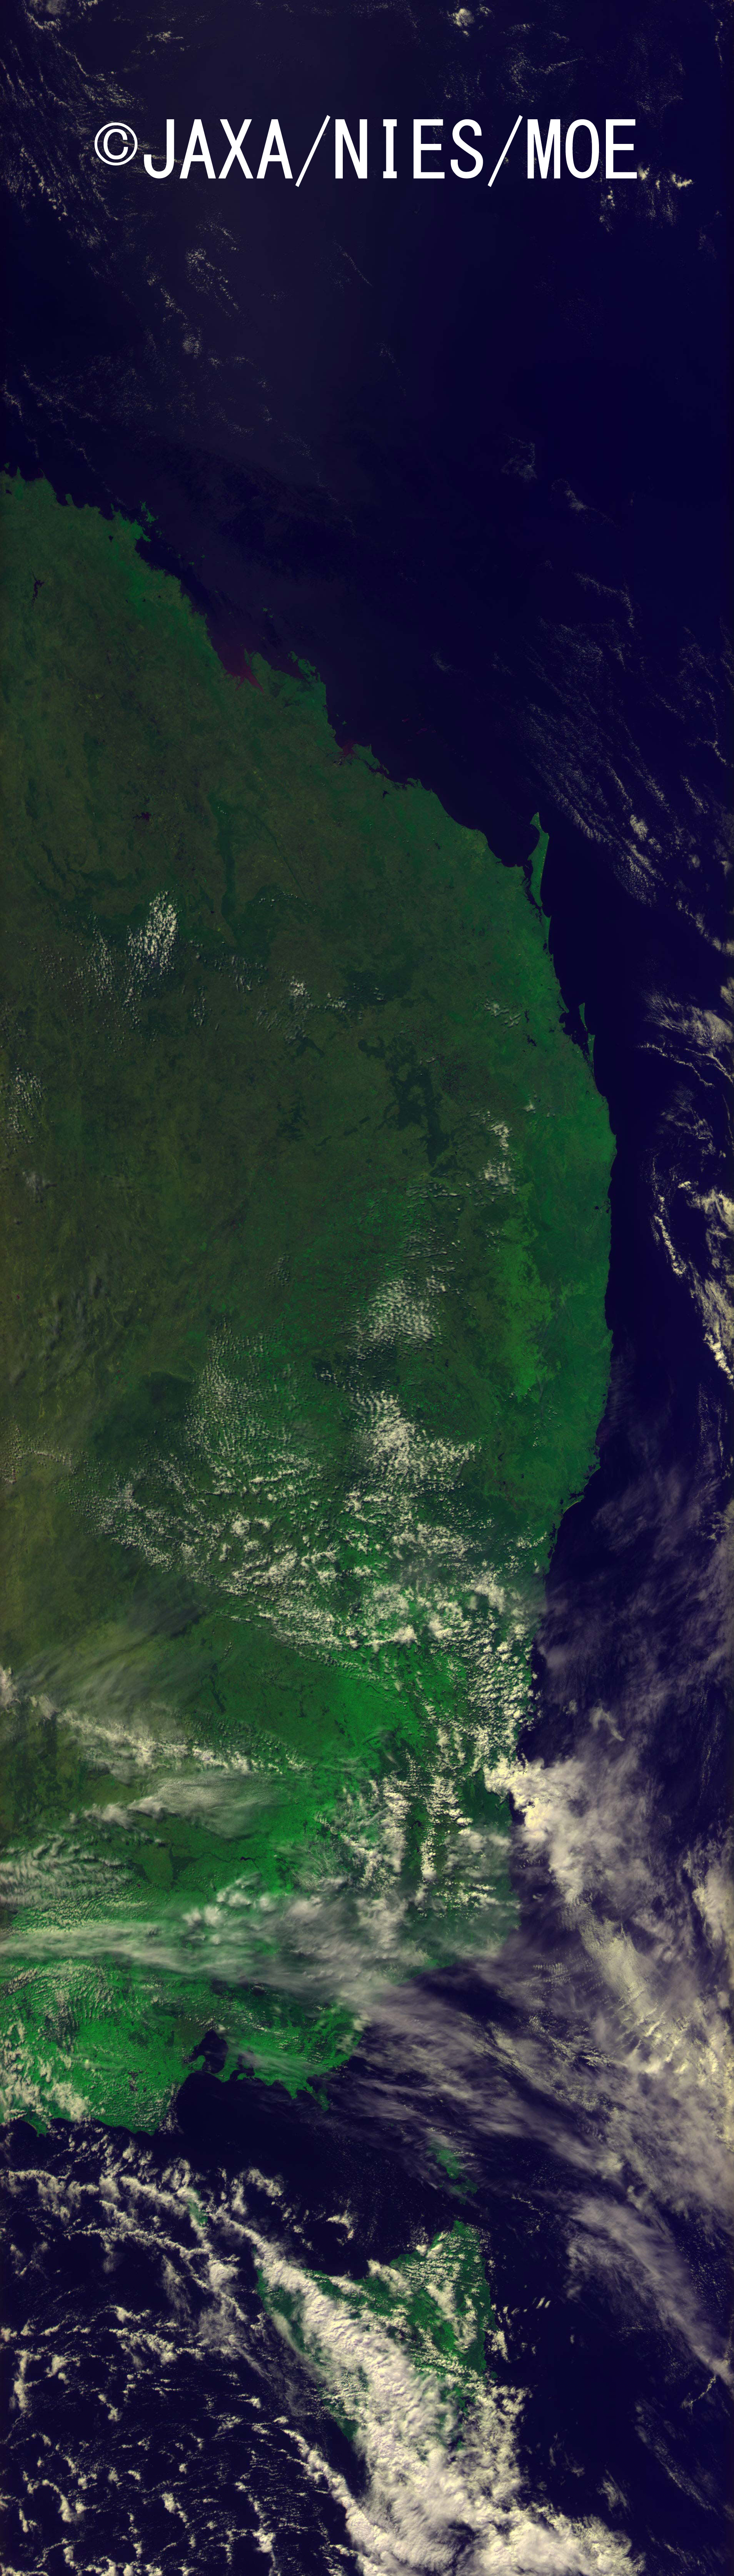


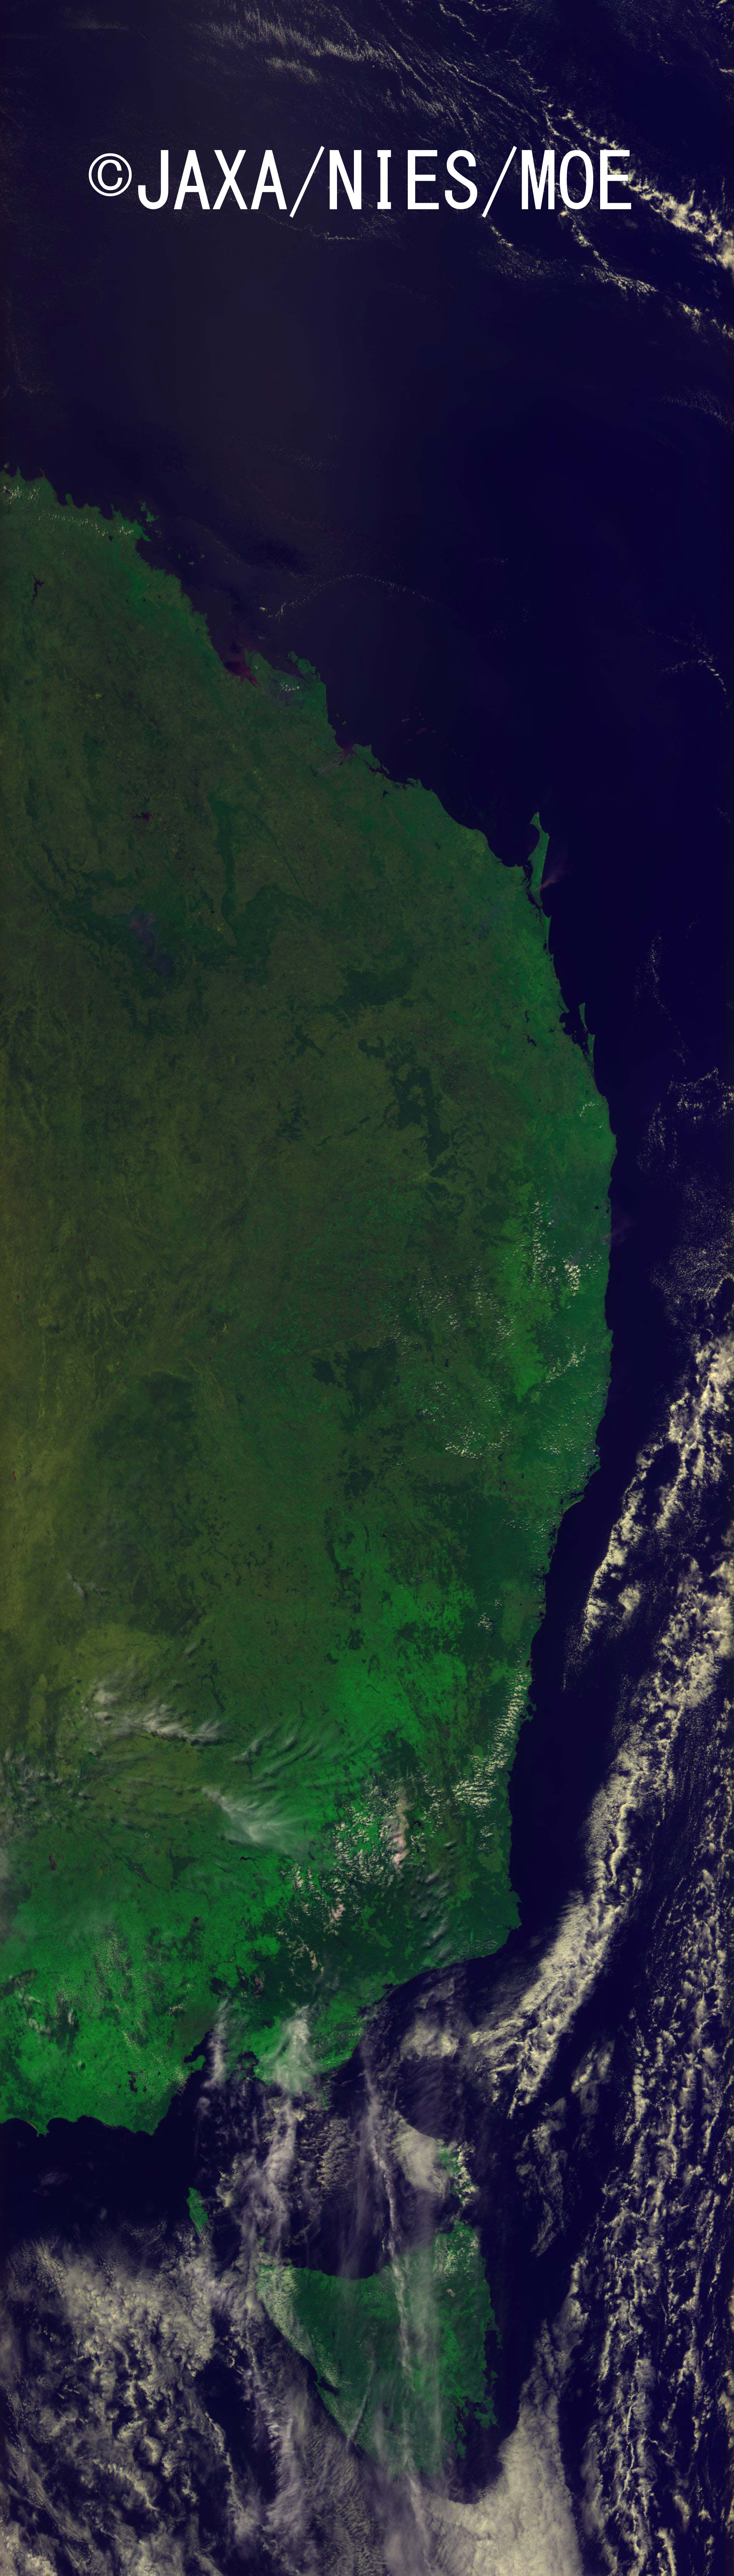
Figure 2: (from the left) The CAI data image of Sep. 20 (before the dust storms were generated,) Sep.23 and 26 (during their attacks,) and Sep 29 (after they disappeared.)
(Blue: ultraviolet region (0.38µm.) Green: near-infrared region (0.87µm.) Red: visible wavelength region (0.68µm.))
(Click here to zoom the image)
October 15, 2009
by the Greenhouse gases Observing SATellite "IBUKI" (GOSAT)
The Ministry of the Environment (MOE), the National Institute for Environmental Studies (NIES) and the Japan Aerospace Exploration Agency (JAXA) are jointly promoting the Greenhouse gases Observing SATellite "IBUKI" (GOSAT), which was launched on January 23, 2009. Recently, "IBUKI" succeeded to observe the eruption of Sarychev Volcano.
The Sarychev Volcano, 1,496 meters high, is located on Matua Island of the Kuril Island chain, and it erupted on June 12, 2009. The smoke from the volcano has disrupted civilian flights on the North American and the European routes and caused delay of the flight. "IBUKI" observes the entire globe and visualize it with the Cloud Aerosol Imager (CAI) mounted on it every three-day period. A plume from the Sarychev Volcano was captured on the CAI image data around 12:00 a.m., Japan standard time, on June 12, 2009 shortly after the eruption began (Figure 1 and Figure 2.) On that day, though the island itself was covered by clouds and can not be seen on the image, the plume reached at the altitude higher than clouds and was seemed to be spread out about 150 kilometers in the east-west direction and about 40 kilometers in the north-south direction. In addition, the Sarychev Volcano was visible on the CAI image data of June 18, 2009, and the plume from the volcano was still recognized. (Figure 3.)
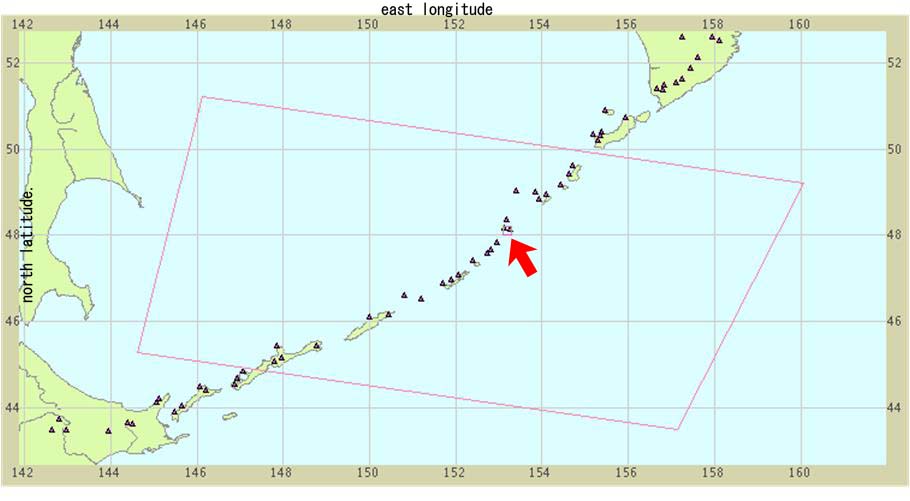
-: The area covered by GOSAT CAI L1B image data (pass 4, frame 3) ∆: major volcanoes
Figure 1: Map of the Kuril Islands and a coverage of the CAI data image.
Black triangle indicates volcanoes. And arrow points the Sarychev Volcano.
(Click here to zoom the image)
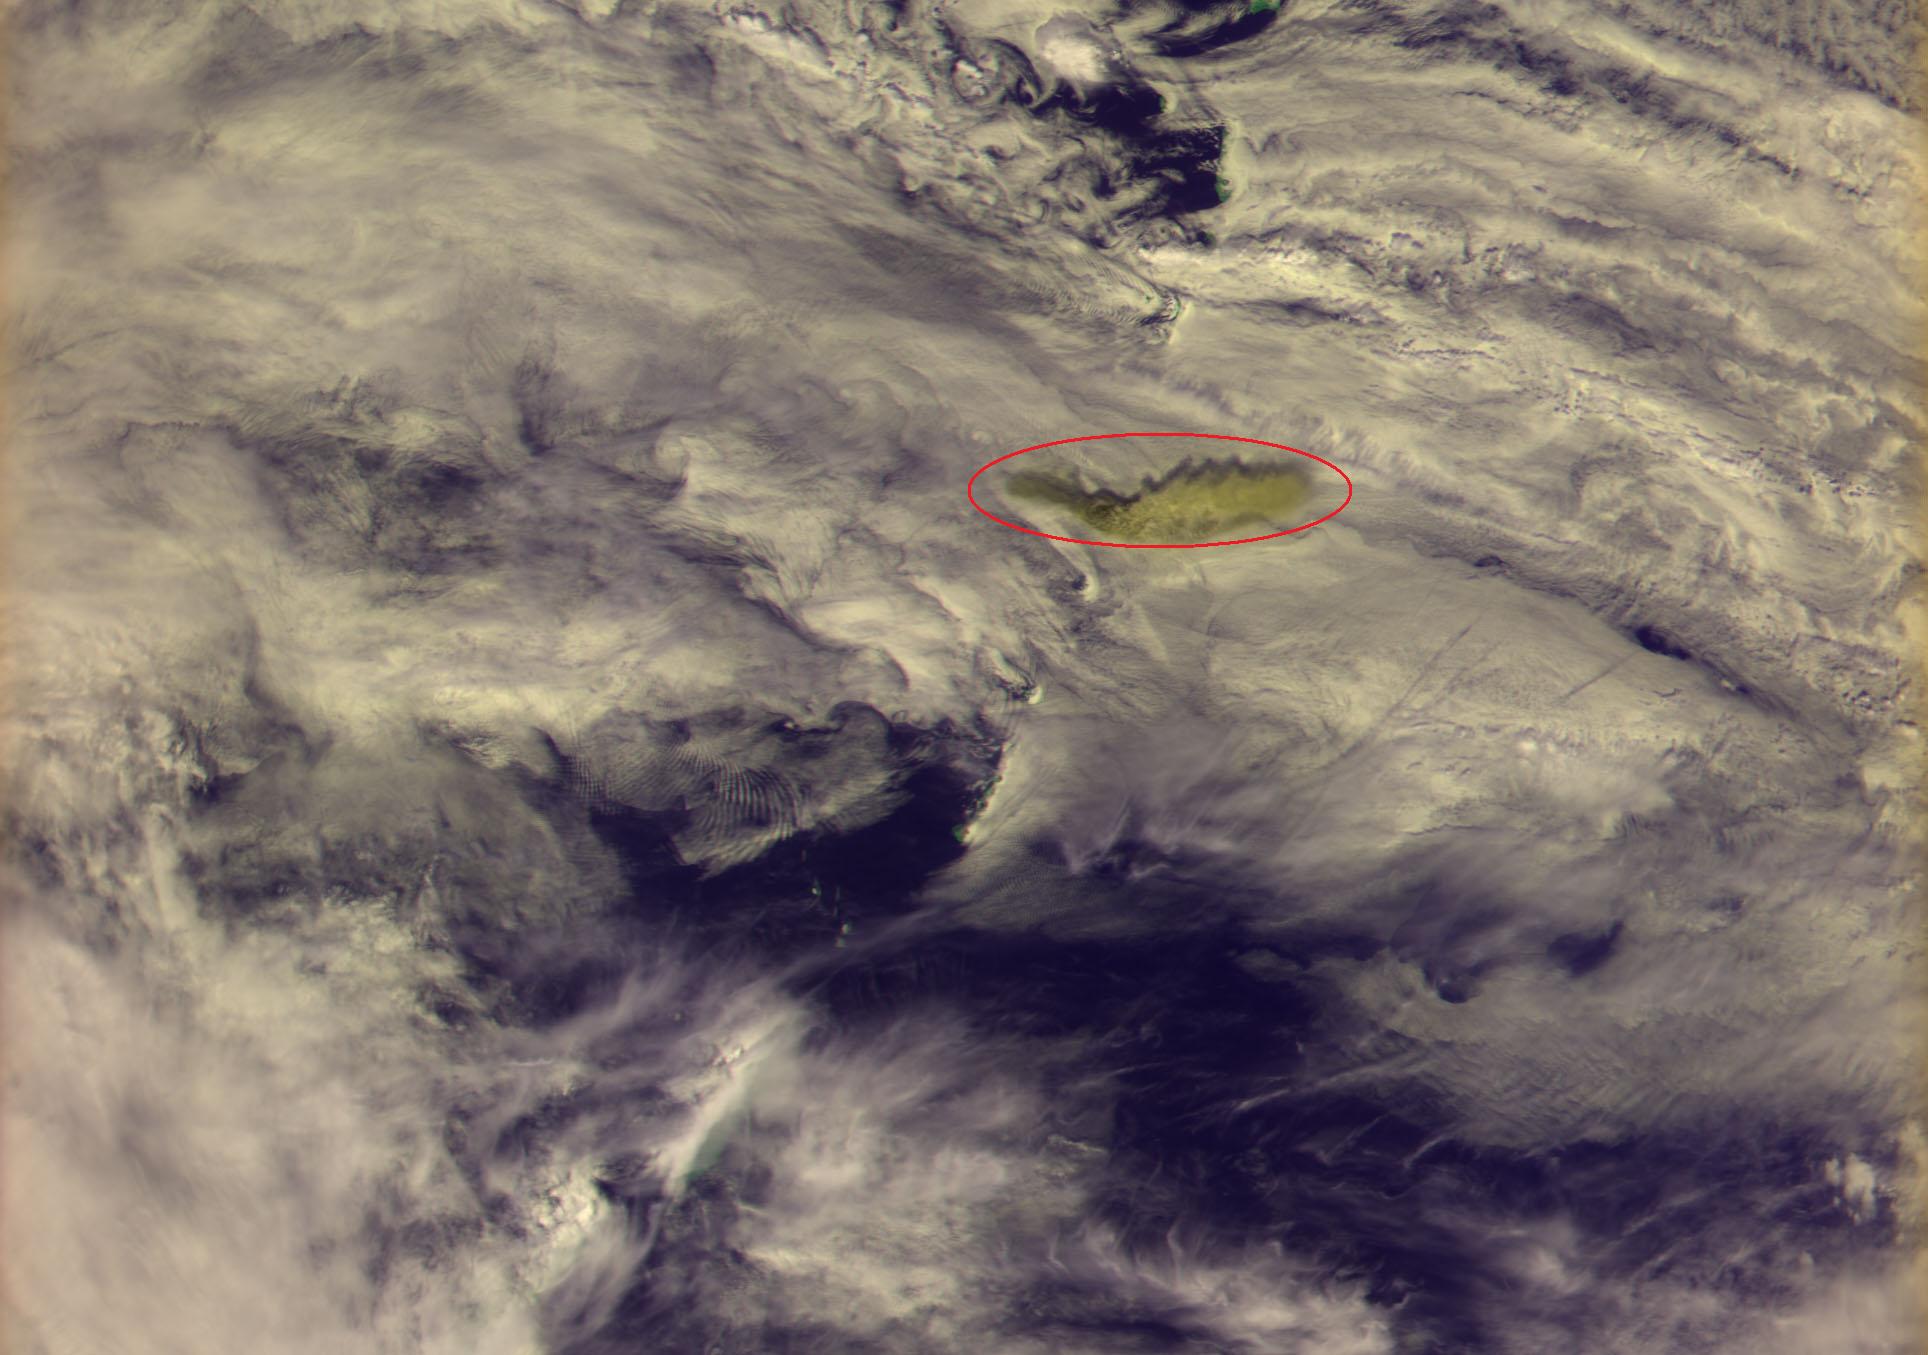
Figure 2: The GOSAT CAI data image taken at 12:14 p.m. on June 12, 2009
(blue: CAI band 1(0.38 µm), red: CAI band 2(0.68 µm), green: CAI band 3(0.87 µm).) The plume from the Sarychev Volcano circled in red is observed in yellowish white color. (Click here to zoom the image)
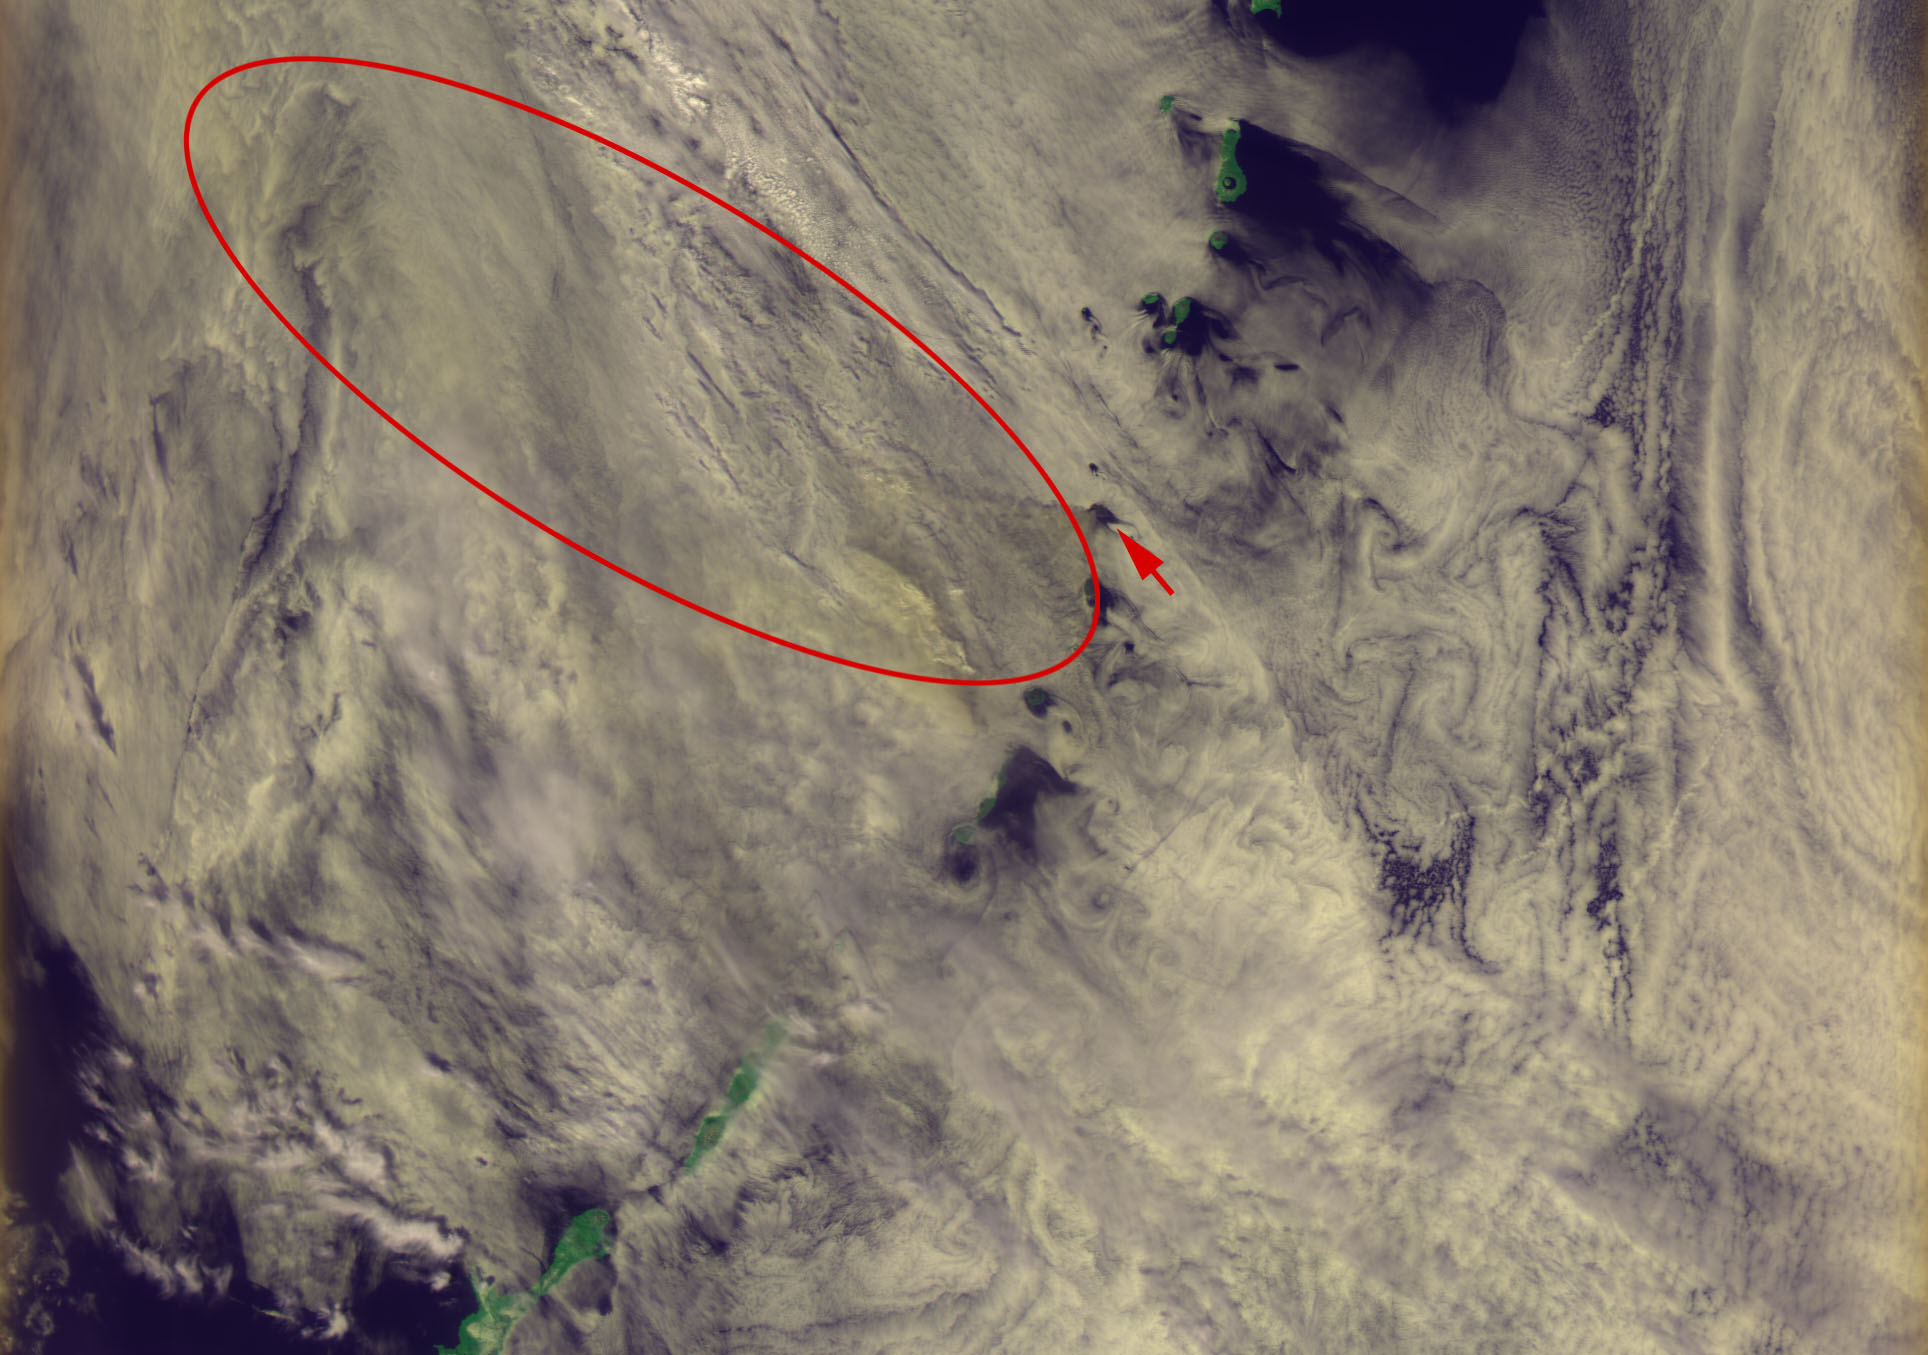
Figure 3: The GOSAT CAI data image taken at 12:14 p.m. on June 18, 2009 (blue: CAI band 1(0.38 µm), red: CAI band 2(0.68 µm), green: CAI band 3(0.87 µm).) The Sarychev Volcano is pointed by an arrow, and its plumes are spread over the area circled in red.
(Click here to zoom the image)