Monthly mean CO2
May 2018
406.9 ppm
CO2 trend (1)
May 2018
405.9 ppm
CO2 growth in the past one year (2)
May 2018 - May 2017
2.2 ppm/yr
Notes:
(1) CO2 trend is a value on the CO2 trend line derived by removing averaged seasonal fluctuations from the monthly CO2 time series. Please note that with a new addition of monthly mean CO2 data, seasonal fluctuations may vary. Accordingly, past CO2 trend values can also change slightly.
(2) CO2 growth refers to an increase of CO2 level on the trend line in the last one year.


Whole-atmosphere monthly mean carbon dioxide concentration
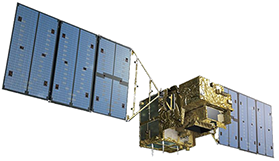
The project of the Greenhouse gases Observing SATellite "IBUKI" (GOSAT), the world’s first satellite designed specifically for monitoring greenhouse gases from space, is jointly promoted by the Ministry of the Environment, Japan, the National Institute for Environmental Studies, and Japan Aerospace Exploration Agency. The satellite has been in operation since its launch on January 23, 2009.
The above chart demonstrates the whole-atmosphere monthly mean concentration of carbon dioxide (CO2), calculated by using GOSAT data that reflect CO2 levels in all layers of the atmosphere. It is also showing seasonal oscillation and yearly rise over the analyzed period. It is also confirmed that the trend line of the whole-atmosphere CO2 mean (average seasonal cycle removed) increases monotonously. The value and the growth of the trend line are important to discuss global warming issues.
Characteristics and significance of greenhouse gas observation by GOSAT
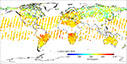
CO2 changes at surface-level monitoring sites and the global CO2 mean based on those observations have long been reported by the World Meteorological Organization and several other meteorological agencies around the world. To further facilitate an understanding of overall trends for CO2 in the atmosphere, knowledge of “whole-atmosphere” CO2 mean is necessary, and for this, more CO2 information in the vertical direction is needed. In fact, from past measurements taken by aircraft, CO2 levels are known to vary with altitude. Model predictions of whole-atmosphere CO2 mean have appeared in the fifth assessment report by the Intergovernmental Panel on Climate Change, as they are important for predicting the risk of global warming due to rising greenhouse gas levels. This is where CO2 observation by GOSAT comes in useful, as the satellite measurement encompasses levels from the surface to the top of the atmosphere and provides CO2 concentration averaged over an entire atmospheric column (this is referred to as column-averaged CO2 concentration).
Whole-atmosphere monthly mean CO2 concentration based on GOSAT data
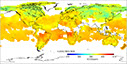
The whole-atmosphere mean CO2 concentration was calculated based on GOSAT measurement. Observational data collected by the satellite over since April 2009 were used for this calculation. Over the analyzed period, the monthly mean CO2 concentration continually rose, with seasonal fluctuations due to photosynthetic activity by plants that intensifies and subsides over a single year in the Northern Hemisphere. The trend line of the global CO2 mean, obtained by subtracting averaged seasonal fluctuations from the monthly CO2 time series, increases monotonously (3). We note here that areas that GOSAT measurement can cover are limited to parts of the globe without cloud cover and where the local solar altitude is above a specific threshold. Therefore, the global distribution of column-averaged CO2 concentration, needed for the calculation of the whole-atmosphere mean CO2 concentration, was estimated from GOSAT data (4). Shown in the figure above are the time series of the monthly mean CO2 concentration and the trend line calculated from the monthly time series (5). The values shown here are found to be smaller by 1-2 ppm than those based on CO2 measurements at the surface level (6).
Notes:
(3) Some of the GOSAT data used in this analysis, dated after February 2015, are still preliminary, pending final validation. The thermoelectric cooler
(cryo-cooler) installed on the observation instrument aboard the satellite (TANSO-FTS) failed on August 2, 2015 and was restarted on September 14.
Thus, for the computation of the whole-atmosphere mean CO2 and the CO2 trend for the months of August and September, we used the following
versions of the GOSAT CO2 concentration data that reflects changes in the characteristics of the observation instrument: ver. 02.50 (between Aug. 2
and Sep. 13); ver.02.60 (after Sep. 15).
(4) More details on the estimation approach used here are described at the following link:
http://www.gosat.nies.go.jp/newpdf/whole_atm_co2_160929_JP.pdf (in Japanese)
(5) Result for January 2015 is missing due to lacking data for instrument adjustment.
(6) US National Oceanic and Atmospheric Administration reported that global mean CO2 concentration based on surface level measurements reached
400 ppm in March 2015.
[Contact Information]
About GOSAT data and analysis results:
NIES Satellite Observation Center, GOSAT Project
Phone: +81-29-850-2966
About GOSAT, onboard sensors, and observation status:
Masakatsu Nakajima
JAXA Space Technology Directorate I
GOSAT-2 Project Team
Phone: +81-50-3362-6130
The GOSAT Project is a joint effort of the Ministry of the Environment (MOE), the National Institute for Environmental Studies (NIES), and the Japan Aerospace Exploration Agency (JAXA)

Privacy Policy | Link | Glossary
Copyright © National Institute for Environmental Studies. All Rights Reserved.