
[5] GOSAT Data Products
Data products distributed from GOSAT DHF
Table 3 lists all types of the GOSAT data products provided for general users. The Level 1 data (FTS Level 1B, CAI Level 1B, and CAI Level 1B+ data) contain spectra and radiances acquired by the satellite. The higher level data products (FTS Level 2, CAI Level 2, FTS Level 3, CAI Level 3, Level 4A, and Level 4B data products) store retrieved physical quantities such as the atmospheric concentrations of CO2 and CH4. Data users can search and order these data products by accessing GDAS (Figure 10). There are some tools introduced on the Technical Information page of the GOSAT website (http://www.gosat.nies.go.jp/index_e.html) for GDAS users to read, check, and visualize the GOSAT data products
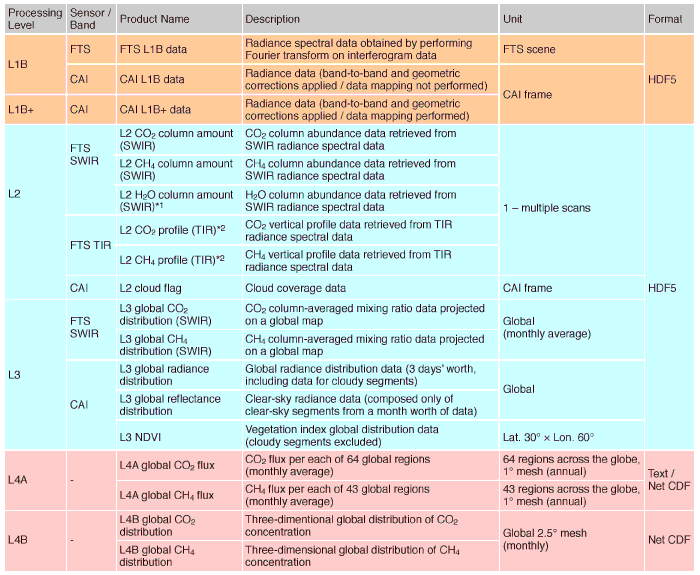
- *1This product is not released to the public yet.
- *2Formerly defined research products of “FTS TIR L2 temperature profile”and“FTS TIR L2 H2O profile” are not defined as each single product now, however, their information is included in respective data records of “FTS TIR L2 CO2 profile” and “FTS TIR L2 CH4 profile”correspondingly.
- The details on the data processing flow are presented in Chapter 3.
- SWIR and TIR stand for Short-Wavelength InfraRed and Thermal InfraRed, respectively. SWIR radiations are detected in thebands 1, 2, and 3 of FTS, and the band 4 captures TIR.
- The column abundance of gas species is defined as the number of the gas molecules in a vertical unit column stretching from the ground surface to the top of the atmosphere.
- An FTS scene and a CAI frame are equivalent to 1/60 of one orbital revolution.
- HDF5 and netCDF are the types of the data file format used for distributing the data products. HDF5 : Hierarchical Data Format version 5 ; netCDF: Network Common Data Form.
- NDVI stands for Normalized-Difference Vegetation Index.
Level 1B and 1B+ data
The FTS Level 1B data (Figure 8) are radiance spectra that are obtained by performing the Fourier transformation on the signals detected by FTS. The degrees to which the targeted gas species absorb the reflected and emitted light in each of the spectral bands can be seen. A single data file of the FTS Level 1B data contains the radiance spectra obtained during 1/60 of an orbital revolution (defined as "one scene").
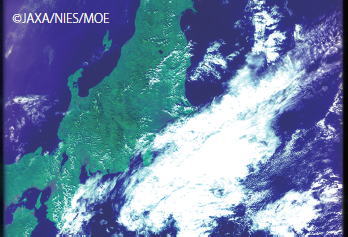
The CAI Level 1B data (Figure 11) are pixel-by-pixel radiances, which are converted from the digital counts of CAI by multiplying the given calibration factors.
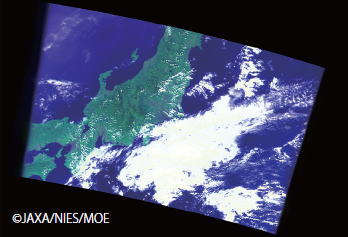
The CAI Level 1B+ data (Figure 12) carry the same Level 1B radiance data, but the geographical locations of the image pixels are corrected for the skewness caused by the topographical roughness of the ground surface and are projected onto a map of the earth via interpolation. A single data file of the CAI Level 1B and Level 1B+ data contains the radiance data obtained during 1/60 of an orbital revolution (defined as "one frame").
Level 2 data products
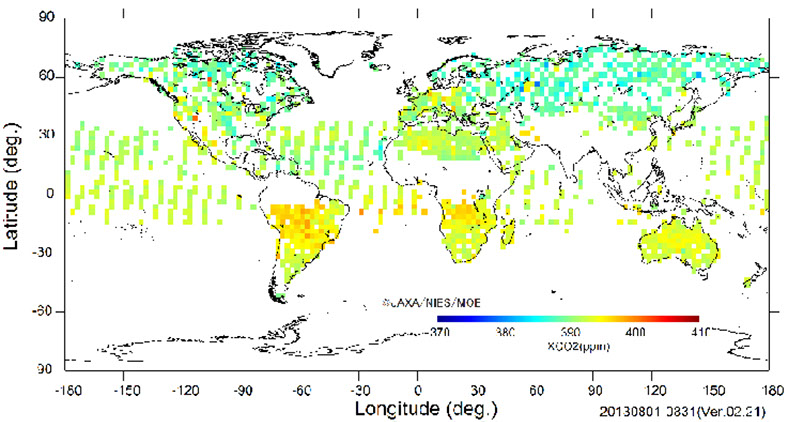
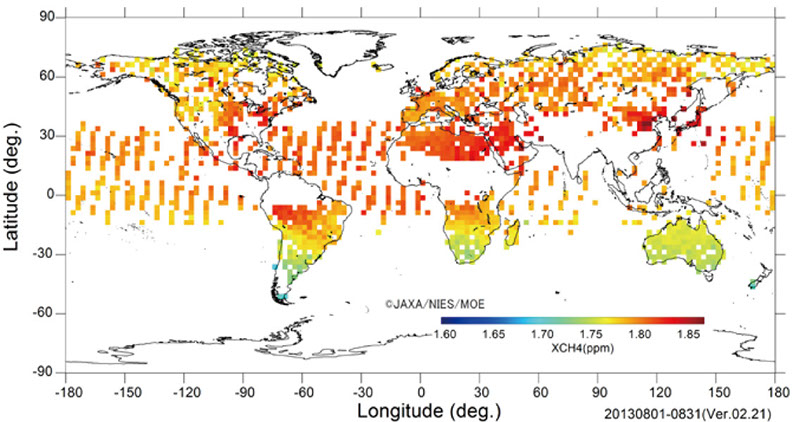
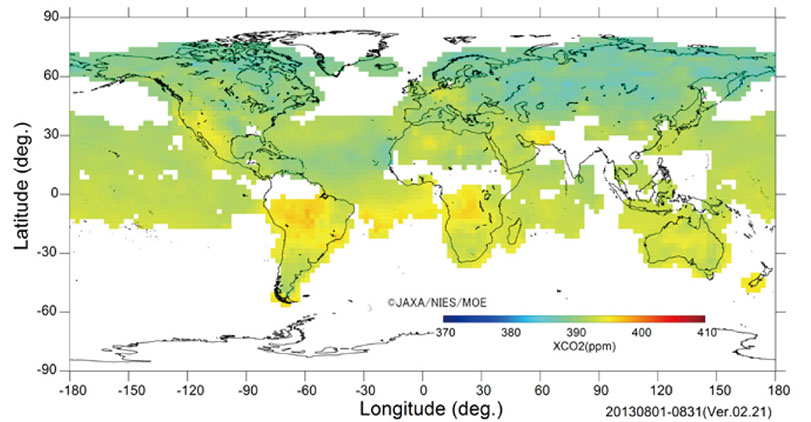
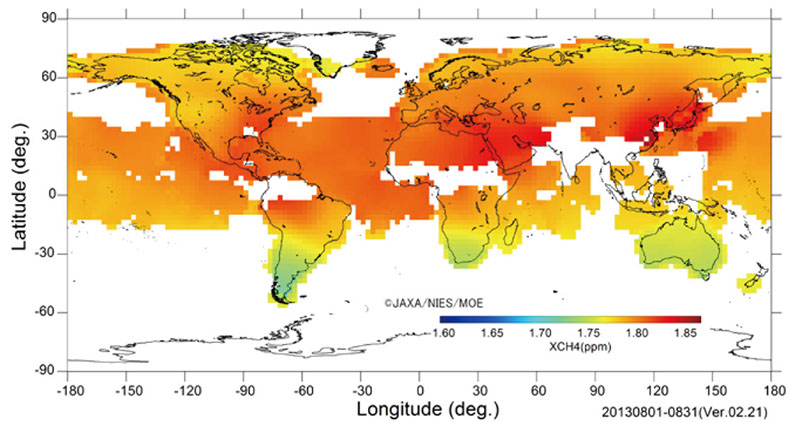
The FTS SWIR Level 2 data products store the column abundances of CO2 and CH4 retrieved from the radiance spectra in the band 1 through 3 of FTS. The column abundance of a gas species is defined as the number of the gas molecule in a vertical unit column stretching from the ground surface to the top of the atmosphere. Figures 13 and 14 show the column-averaged mixing ratios of CO2 and CH4. The column-averaged mixing ratio of a gas species is given by dividing the column abundance of the gas by that of dry air. For improving the quality of the data products, the Level 2 data processing algorithm has continuously been updated. The validation of the Level 2 data products is also ongoing (explained in Chapter 6).
The FTS TIR Level 2 data products are vertical concentration profiles of CO2 and CH4 derived from the radiance spectra in the band 4 of FTS.
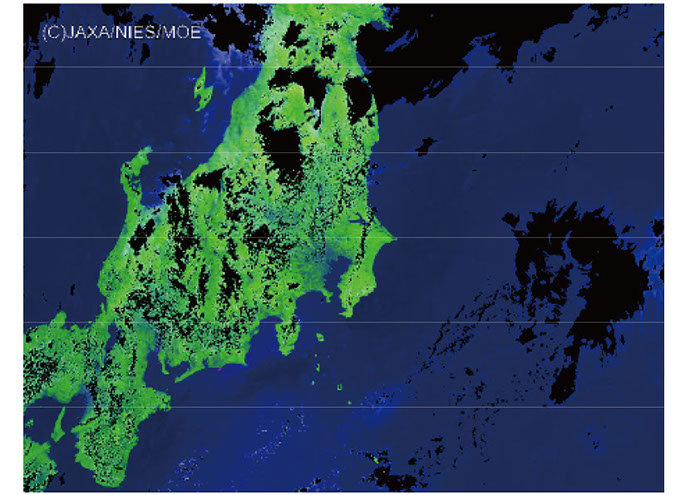
The Level 2 cloud flag data product (Figure 15) stores the clear-sky confidence levels that are calculated from the CAI Level 1B data.
Level 3 data products
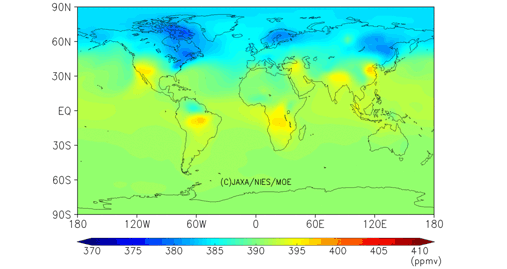
The FTS SWIR Level 3 data products (Figures 16 and 17) are generated by interpolating, extrapolating, and smoothing the FTS SWIR Level 2 column-averaged mixing ratios of CO2 and CH4 on a monthly basis. A geostatistical calculation technique called Kriging method is applied. The values are gridded to 2.5-degree cells.
The CAI Level 3 radiance distribution data product (Figure 18) is prepared in a three-day cycle; the CAI radiance data collected during the three-day period are assembled to give a global cloud distribution map.
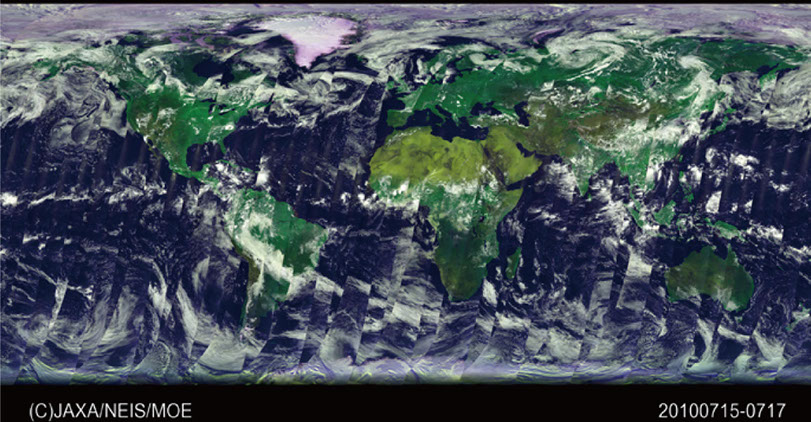
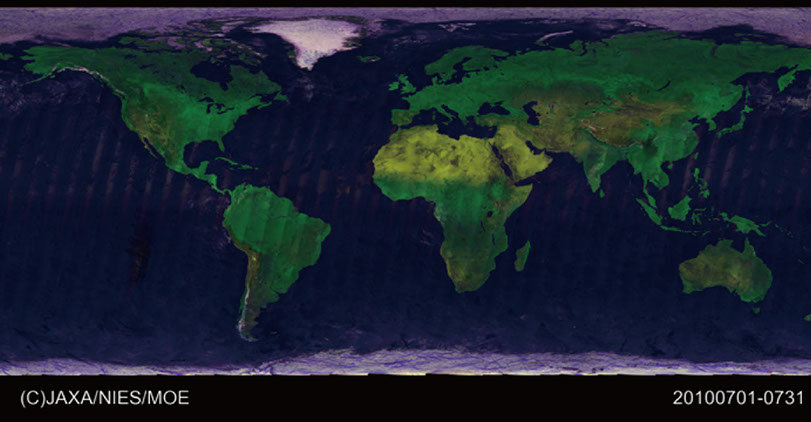
The CAI Level 3 global reflectance distribution (clear-sky) data product (Figure 19) shows the features of the ground surface globally. These data are processed by selecting the least cloudy images from the CAI data collected in a month and consolidating them on a global map.
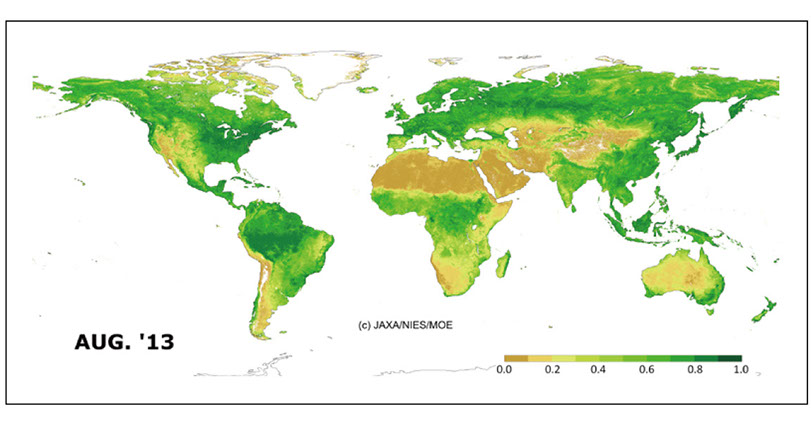
The Level 3 normalized-difference vegetation index (NDVI) (Figure 20) data are generated by contrasting the CAI radiances in band 3, which are sensitive to ground surface vegetations, to those in band 2, which are less sensitive to the vegetations.
Level 4 data products
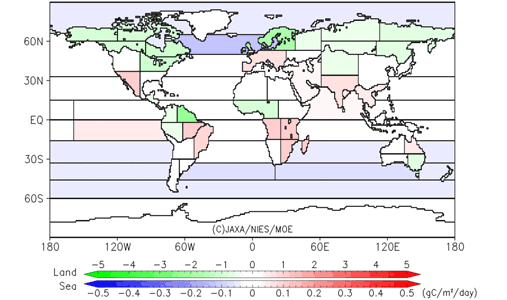
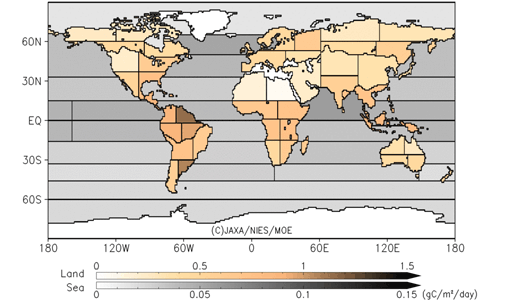
The Level 4A data product (Figure 21 and 22 for CO2) shows monthly averaged source/sink strengths (fluxes) of CO2 and CH4 in 64 and 43 regions respectively with their uncertainties that are inversely estimated from the FTS SWIR Level 2 column-averaged mixing ratios, ground-based observational data, and other meteorological data such as wind direction and velocity, using a global atmospheric transport model.
The Level 4B data product presents global CO2 and CH4 concentrations in three dimensions (Figure 23) calculated from the Level 4A data product using the atmospheric transport model. The data product has a horizontal resolution of 2.5x 2.5 and a time step of six hours.