![GOSAT PROJECT [ THE GREENHOUSE GASES OBSERVING SATELLITE: GOSAT 'IBUKI' ]](../../img/img_top.jpg)
2013
- January
- February
- March
- April
- May
- June
- July
- August
- September
- October
- November
- December
June, 2013
June 25, 2013
National Institute for Environmental Studies
Center for Global Environmental Research
GOSAT Project
GOSAT-2 Project Team
Last week, a severe smog, resulting from forest fires, triggered by slash-and-burn farming in Indonesia, reached the neighboring country of Singapore. Images of this phenomenon were captured by the Cloud and Aerosol Imager (CAI) onboard GOSAT, the Greenhouse Gases Observing SATellite, between June 19th and 23rd, 2013.
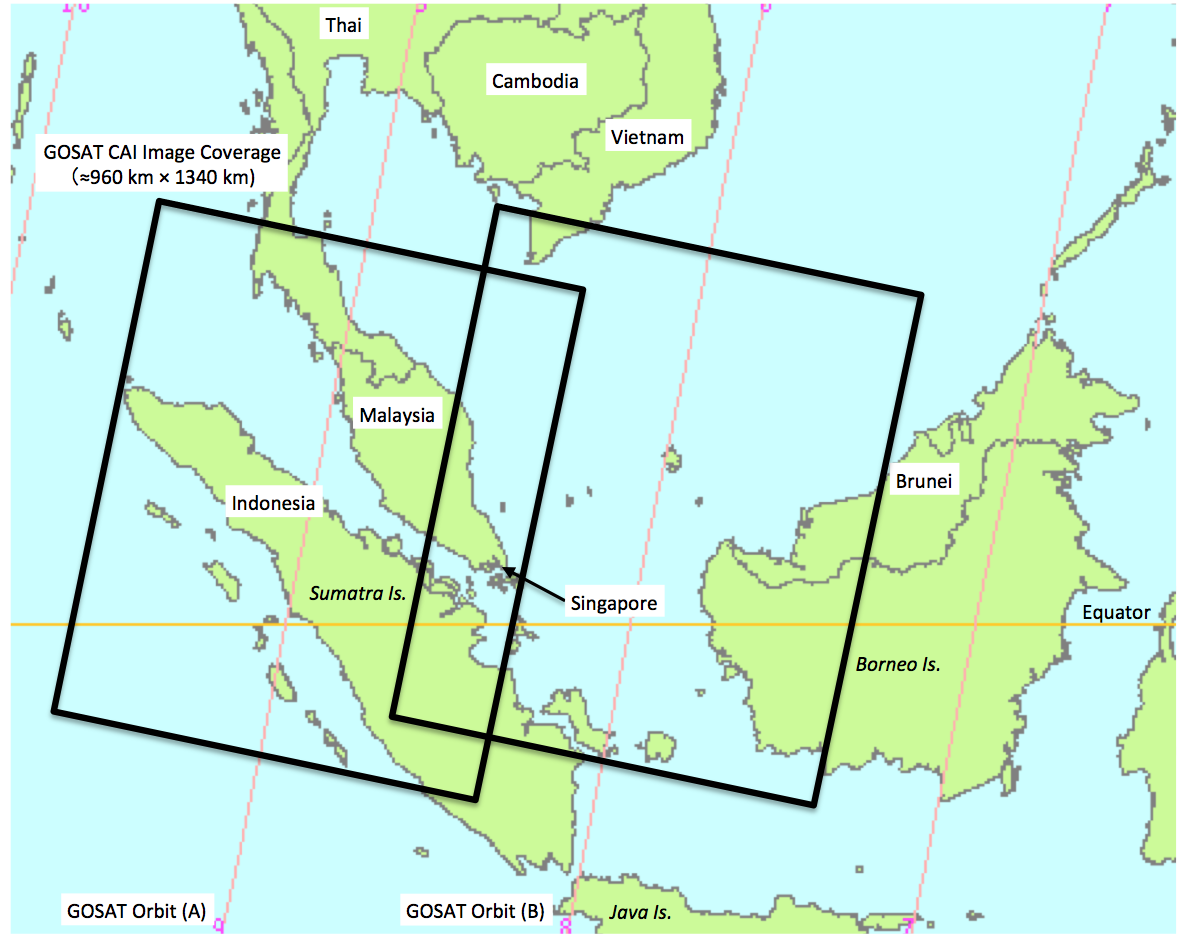
Figure 1. Geographic boundaries of the scenes photographed by the CAI on GOSAT.
Orbit A: June 20 and June 23, Orbit B: June 19 and June 22
(the orbits tracks are represented by the thin red diagonal lines).
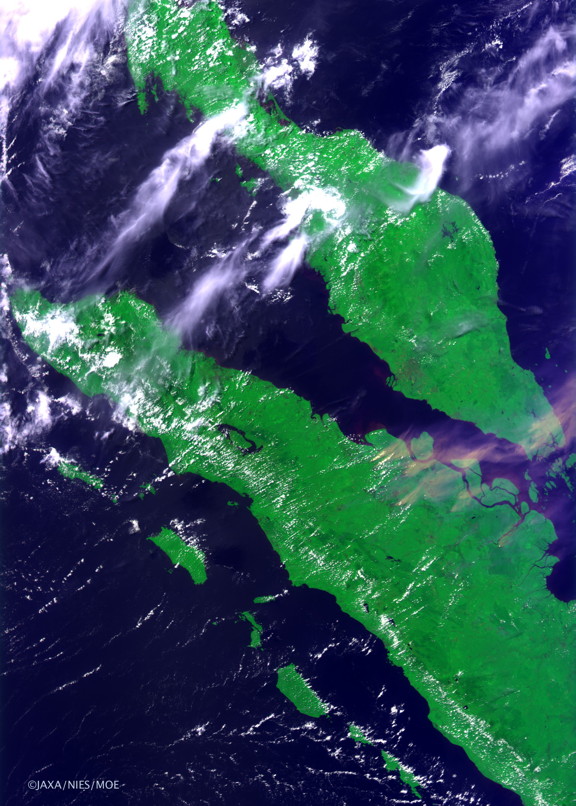
Figure 2. Image captured by the CAI on June 20, 2013 (click to enlarge).
The smog, triggered by forest fires and slash-and-burn farming in Riau, Indonesia (Central area of Sumatra island, center right of the image) was transported by south-westerly winds towards the Singapore area. The CAI on GOSAT observes at ultraviolet wavelengths (in Band 1) to visualize smoke (cream yellow color), and clouds (white color).
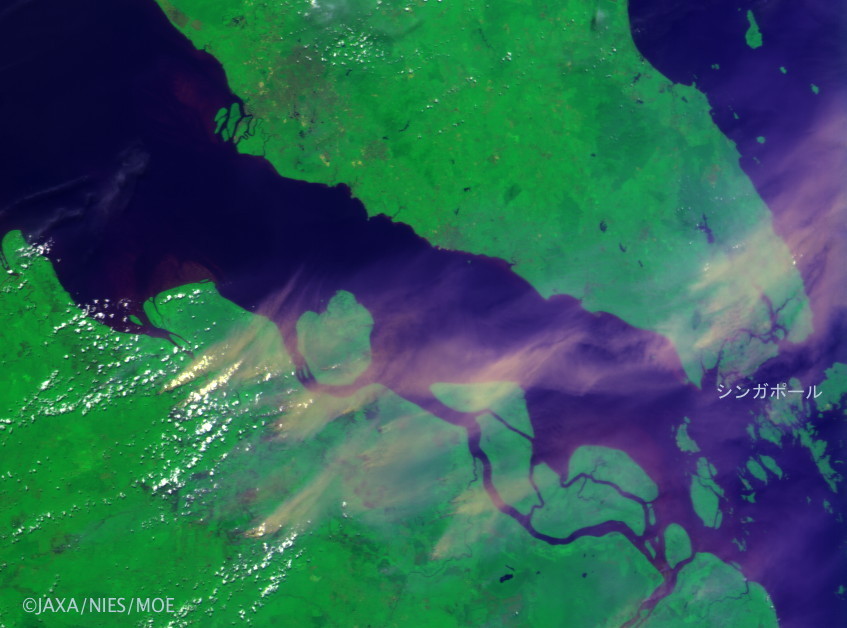
Figure 3. Enlarged image showing the Singapore area.
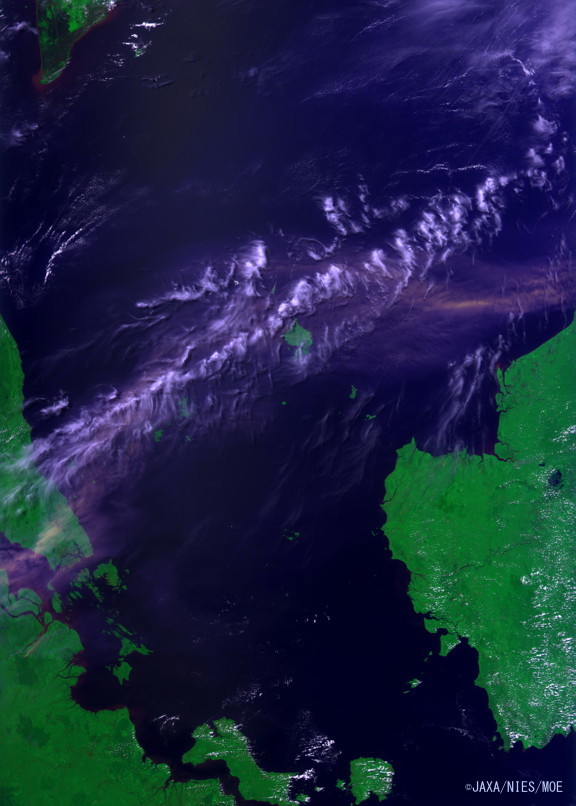
Figure 4. Image captured by the CAI on June 19, 2013 (click to enlarge).
This image shows that the smog spread along an almost straight line from Riau, Indonesia to southern Malaysia and to Singapore, reaching as far as the north-western shore of Borneo Island.
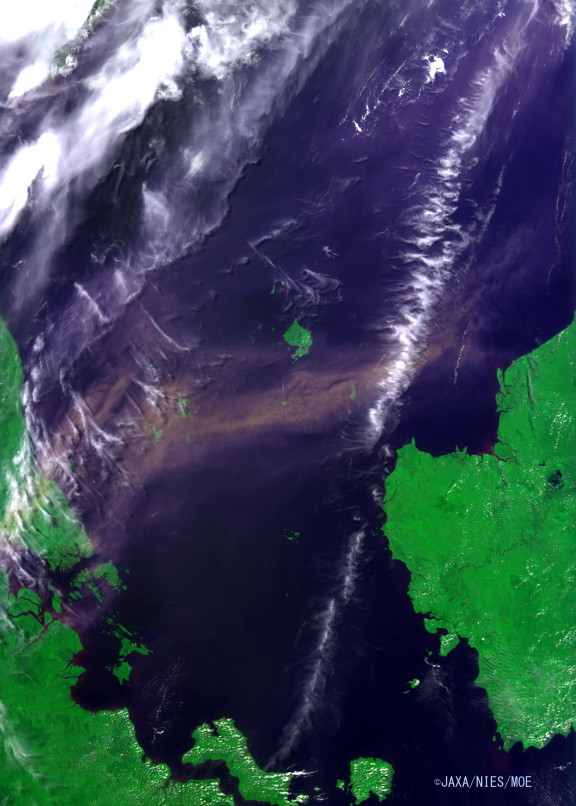
Figure 5. Image captured by the CAI on June 22, 2013 (click to enlarge).
Like Figure 4, this image shows the smog spreading almost linearly from Riau, Indonesia to southern Malaysia and to Singapore, reaching as far as the north-western shore of Borneo Island. On June 22nd, the smog over the ocean appears thicker than three days before.
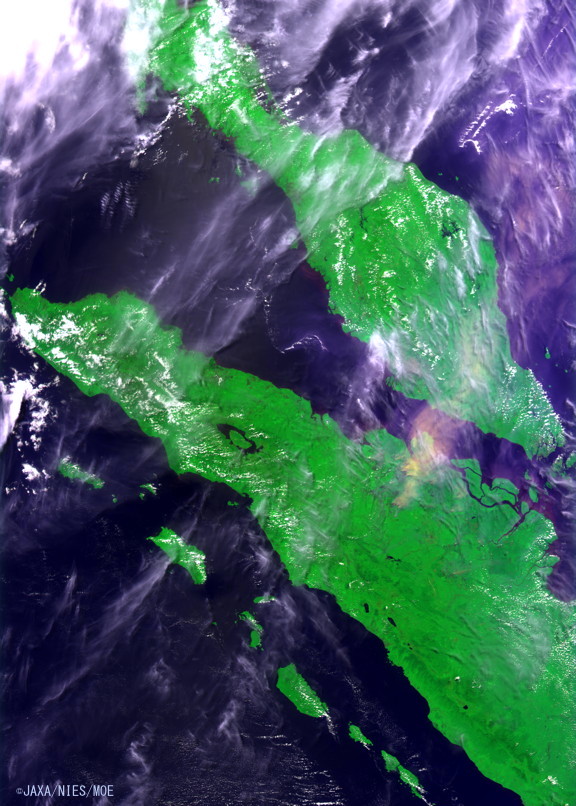
Figure 6. Image captured by the CAI on June 23, 2013 (click to enlarge).
This image shows that, on June 23rd, the wind direction changed to the East-North-East. Therefore, barely any smog can be seen above Singapore.
Information )
Instrument : Cloud and Aerosol Imager (CAI)
GOSAT Product : CAI L1B product (V01.00) Path 8 and Path 9; Frames 30-31
Observed dates :
Figure 2 and Figure 3: June 20, 2013 - UTC 6:12 (JST 15:12)
Figure 4 : June 19, 2013 - UTC 5:40 (JST 14:40)
Figure 5 : June 22, 2013 - UTC 5:40 (JST 14:40)
Figure 6 : June 23, 2013 - UTC 6:12 (JST 15:12)
Image Processing : Merging of two consecutive scenes (L1B product) captured by the CAI.
Scale : about 960 km (WNW<=>ENE) x 1340 km (NNE<=>NNW)
Resolution : 500 m / pixel
Pseudo-colors : RGB composite using CAI Band 1 (wavelength 380 nm) for blue, Band 2 (wavelength 674 nm) for red, and Band 3 (wavelength 870 nm) for green.
Explanation of the pseudo-color terms : navy blue shows ocean, bright green shows vegetation, white shows cloud, and cream yellow or shell pink shows smog.